Commentary
Print Print Subscribe

Ninepoint Global Real Estate Fund

Global Real Estate Fund - July 2024
Key Takeaways
  • Ninepoint Global Real Estate Fund had a YTD return of 8.32% up to July 31, compared to the MSCI World IMI Core Real Estate Index’s total return of 7.36%.
  • In July, the Fund generated a total return of 8.00% while the Index generated a total return of 7.03%.
  • The recent 10% market drawdown was triggered by a combination of factors, including a rotation out of mega-cap growth stocks, political uncertainty in the U.S., weakening economic indicators, and a surprise interest rate hike by the Bank of Japan.
  • But year-to-date, economic data, including the US PCE price index, has supported the market's move higher, with index-level performance aligning with rising expectations and easing inflation concerns.
  • Despite the market volatility, earnings reports have been generally positive, with strong year-over-year growth in several sectors, particularly Utilities, Information Technology, Financials, Health Care, and Consumer Discretionary.
  • While valuations have slightly declined after the correction, they remain above historical averages. However, analysts expect continued earnings growth in 2024 and 2025, which could support a broader market rally in the latter half of 2024.
  • The Fund is currently overweight Specialized REITs, Industrial REITs, and Health Care REITs while underweight Real Estate Management & Development, Diversified REITs, and Office REITs.
  • The Fund was concentrated in 26 positions, with the top 10 holdings accounting for approximately 45.3% of the fund. 17 out of our 26 holdings have announced a dividend increase, with an average hike of 4.2%.

Monthly Update

Year-to-date to July 31, the Ninepoint Global Real Estate Fund generated a total return of 8.32% compared to the MSCI World IMI Core Real Estate Index, which generated a total return of 7.36%. For the month, the Fund generated a total return of 8.00% while the Index generated a total return of 7.03%.

Ninepoint Global Real Estate Fund - Compounded Returns¹ As of July 31, 2024 (Series F NPP132) | Inception Date: August 5, 2015

1M

YTD

3M

6M

1YR

3YR

5YR

Inception

Fund

8.0%

8.3%

12.5%

9.7%

10.2%

-0.9%

4.7%

6.6%

MSCI World IMI Core Real Estate Index

7.0%

7.8%

10.5%

10.6%

13.6%

-0.3%

2.0%

3.7%

In the stock market, things can happen slowly then suddenly all at once. Historically, 5% drawdowns happen about three times a year while 10% drawdowns happen about once a year and we’ve just experienced the latter. The cause of this most recent drawdown was a confluence of factors finally adding up to shake investor confidence. It started with a rotation out of the mega cap growth leaders that has been underway since about the middle of July, as the US political situation and expectations for the upcoming election fluctuated wildly. There were also signs that the US economy and the US consumer were weakening even before some of the Mag7 stocks reported what could be considered mixed results. Further, the Fed declined to cut interest rates in July but, only two days later, a very weak nonfarm payroll report elicited fears that the Fed was behind the curve. Finally, after maintaining essentially zero interest rate policy for more than twenty years, the Bank of Japan raised interest rates by 25 bps, a tiny but significant move, which triggered a rapid unwind of the Yen carry trade. The interconnectedness of this trade was apparent in the broad selloff across many asset classes and was most violently evident in the Nikkei 25, which plunged 12.4% in a single day.

Thankfully, reassuring comments out of the BoJ and various US FOMC members seems to have stabilized the markets, at least temporarily. Recent earnings also have been generally supportive, outside some of the Mag7, and with 91% of the S&P 500 companies having reported, 78% have reported a positive EPS surprise and 59% have reported a positive revenue surprise (according to FactSet). For Q2, the blended (actual and forecasted) year-over-year earnings growth rate of the S&P 500 is 10.8%, which if it holds would be the highest earnings growth rate since Q4 2021, back when we were lapping the Covid lockdown quarters.

In this quarter, earnings growth has been led by the Utilities, Information Technology, Financials, Health Care and Consumer Discretionary sectors, while the Materials and Industrials sectors have been the only sectors to report a year-over-year decline. But the outlook remains good and for 2024 and 2025 analysts are expecting earnings growth of 10.2% and 15.2% respectively. Plus, valuations have improved and after the correction the forward P/E ratio is approximately 20.2x, which is above the 5-year average of 19.4x and above the 10-year average of 17.9x, but below the forward P/E ratio of 21.0x at the end of the second quarter of 2024. We expect that the earnings growth rates of the Mag7 and the rest of the market will narrow through the remainder of 2024, which should support broader participation as the rally eventually resumes its upward trend sometime in Q3 or Q4.1

Importantly, although the Fed did not cut interest rates in July, we fully expect that the first interest rate cut of the cycle will be confirmed at the August Jackson Hole Economic Symposium and will occur in September. After the last FOMC meeting, we think that Chairman Powell struggled to find convincing arguments to support a hawkish stance any longer and, because many FOMC members still expect at least two interest rate cuts in 2024, we believe that two 25 bps cuts are likely by the end of the year.

From there, the Fed will likely proceed with a series of 25 bps interest rate cuts through 2025 to orchestrate an economic soft-landing. However, this outcome is not assured, and we are mindful that some of the recent data suggests that the US economy may be slowing faster than anticipated by the Fed. We are also nervous that the US Presidential elections will create added uncertainty, which may cause volatility to pick up as we get closer to November, much like the 2016 and 2020 election years. Despite these concerns, we are continually searching for companies that are expected to post solid revenue, earnings and dividend growth but still trade at acceptable valuations today.

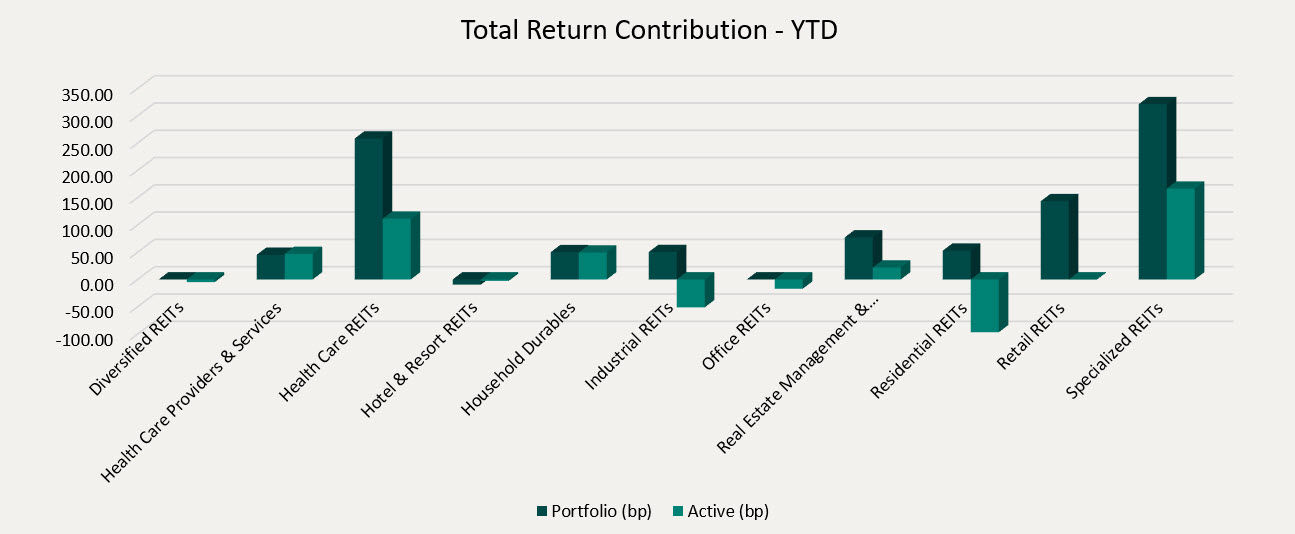
Top contributors to the year-to-date performance of the Ninepoint Global Real Estate Fund by sub-industry included Specialized REITs (+321 bps), Health Care REITs (+258 bps) and Retail REITs (+143 bps), while top detractors by sector included only Hotel & Resort REITs (-10 bps) on an absolute basis.

On a relative basis, positive return contributions from the Specialized REITs (+166 bps), Health Care REITs (+111 bps) and Household Durables (+49 bps) sub-industries were offset by negative contributions from the Residential REITs (-97 bps), Industrial REITs (-51 bps) and Office REITs (-17 bps) sub-industries.

Total Return Contribution - YTD
Source: Ninepoint Partners

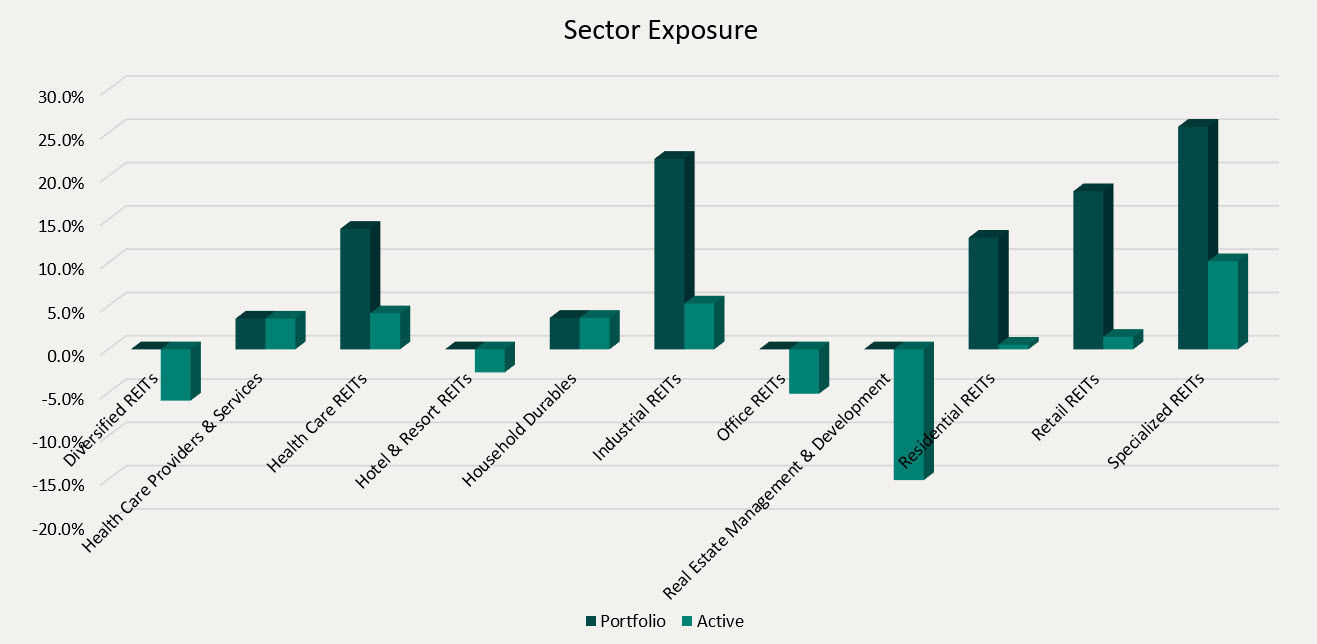
We are currently overweight Specialized REITs, Industrial REITs, and Health Care REITs while underweight Real Estate Management & Development, Diversified REITs, and Office REITs. As investors begin to assess the implications of the upcoming US Presidential election and the first interest rate cut of the cycle, are carefully watching the economic data to determine if the soft-landing scenario materializes. In the meantime, we remain focused on high quality, dividend paying real estate assets that have demonstrated the ability to consistently generate revenue and cash flow growth through the business cycle.

Sector Exposure
Source: Ninepoint Partners

The Ninepoint Global Real Estate Fund was concentrated in 26 positions as at July 31, 2024 with the top 10 holdings accounting for approximately 45.3% of the fund.  Over the prior fiscal year, 17 out of our 26 holdings have announced a dividend increase, with an average hike of 4.2% (median hike of 3.1%). Using a total real estate approach, we will continue to apply a disciplined investment process, balancing valuation, growth, and yield in an effort to generate solid risk-adjusted returns.

Jeffrey Sayer, CFA
Ninepoint Partners

1FactSet Earnings Insight

Fund Announcement

Ninepoint Partners LP announced on July 5, 2024, a proposal to merge (the Merger) Ninepoint Global Real Estate Fund (the Terminating Fund) into Ninepoint Global Infrastructure Fund (the Continuing Fund). The Terminating Fund will cease to be available for sale effective immediately. Following the Merger, pre-authorized purchase plans established for purchases of units of the Terminating Fund will be immediately transferred to the equivalent series of units of the Continuing Fund. Read the full press release here

Historical Commentary

View All
  • Ninepoint Global Real Estate Fund
    Year-to-date to June 30, the Ninepoint Global Real Estate Fund generated a total return of 0.30% compared to the MSCI World IMI Core Real Estate Index, which generated a total return of 0.68%. For the month, the Fund generated a total return of 1.96% while the Index generated a total return of 0.75%.
    Real Estate
  • Ninepoint Global Real Estate Fund
    Year-to-date to May 31, the Ninepoint Global Real Estate Fund generated a total return of -1.62% compared to the MSCI World IMI Core Real Estate Index, which generated a total return of -0.07%. For the month, the Fund generated a total return of 2.21% while the Index generated a total return of 2.48%.
    Real Estate
  • Ninepoint Global Real Estate Fund
    Year-to-date to April 30, the Ninepoint Global Real Estate Fund generated a total return of -3.75% compared to the MSCI World IMI Core Real Estate Index, which generated a total return of -2.49%. For the month, the Fund generated a total return of -6.72% while the Index generated a total return of -4.48%.
    Real Estate
  • Ninepoint Global Real Estate Fund
    Year-to-date to March 31, the Ninepoint Global Real Estate Fund generated a total return of 3.19% compared to the MSCI World IMI Core Real Estate Index, which generated a total return of 2.08%. For the month, the Fund generated a total return of 1.50% while the Index generated a total return of 3.28%.
    Real Estate
  • Global Real Estate Fund
    Year-to-date to February 29, the Ninepoint Global Real Estate Fund generated a total return of 1.66% compared to the MSCI World IMI Core Real Estate Index, which generated a total return of -1.17%. For the month, the Fund generated a total return of 3.00% while the Index generated a total return of 1.47%.
    Real Estate
  • Global Real Estate Fund
    Year-to-date to January 31, the Ninepoint Global Real Estate Fund generated a total return of -1.30% compared to the MSCI World IMI Core Real Estate Index, which generated a total return of -2.60%. The year 2024 has started off much like 2023 ended, with stocks in the Communication and Information Technology sectors continuing to rally.
    Real Estate

Effective February 7, 2017 the Sprott Global REIT & Property Equity Fund’s name was changed to Sprott Global Real Estate Fund, subsequently on August 1, 2017 becoming Ninepoint Global Real Estate Fund.

All returns and fund details are a) based on Series F units; b) net of fees; c) annualized if period is greater than one year; d) as at 7/31/2024; e) 2015 annual returns are from 08/04/15 to 12/31/15. The index is 100% MSCI World IMI Core Real Estate NR (CAD) and is computed by Ninepoint Partners LP based on publicly available index information.

The Fund is generally exposed to the following risks: Capital depletion risk; Concentration risk; Credit risk; Currency risk; Cybersecurity risk; Derivatives risk; Emerging markets risk; Equity real estate investment trust (REIT) securities risk; Exchange traded funds risk; Foreign investment risk; Income trust risk; Inflation risk; Interest rate risk; Liquidity risk; Market risk; Preferred stock risk; Real estate risk; Regulatory risk; Securities lending, repurchase and reverse purchase transactions risk; Series risk; Short selling risk; Specific issuer risk; Substantial securityholder risk; Tax risk.

Ninepoint Partners LP is the investment manager to the Ninepoint Funds (collectively, the “Funds”). Commissions, trailing commissions, management fees, performance fees (if any), and other expenses all may be associated with investing in the Funds. Please read the prospectus carefully before investing. The indicated rate of return for series F units of the Fund for the period ended 7/31/2024 is based on the historical annual compounded total return including changes in unit value and reinvestment of all distributions and does not take into account sales, redemption, distribution or optional charges or income taxes payable by any unitholder that would have reduced returns. Mutual funds are not guaranteed, their values change frequently and past performance may not be repeated. The information contained herein does not constitute an offer or solicitation by anyone in the United States or in any other jurisdiction in which such an offer or solicitation is not authorized or to any person to whom it is unlawful to make such an offer or solicitation. Prospective investors who are not resident in Canada should contact their financial advisor to determine whether securities of the Fund may be lawfully sold in their jurisdiction.

The opinions, estimates and projections (“information”) contained within this report are solely those of Ninepoint Partners LP and are subject to change without notice. Ninepoint Partners makes every effort to ensure that the information has been derived from sources believed to be reliable and accurate. However, Ninepoint Partners assumes no responsibility for any losses or damages, whether direct or indirect, which arise out of the use of this information. Ninepoint Partners is not under any obligation to update or keep current the information contained herein. The information should not be regarded by recipients as a substitute for the exercise of their own judgment. Please contact your own personal advisor on your particular circumstances.

Views expressed regarding a particular company, security, industry or market sector should not be considered an indication of trading intent of any investment funds managed by Ninepoint Partners. Any reference to a particular company is for illustrative purposes only and should not to be considered as investment advice or a recommendation to buy or sell nor should it be considered as an indication of how the portfolio of any investment fund managed by Ninepoint Partners is or will be invested.

Ninepoint Partners and/or its affiliates may collectively beneficially own/control 1% or more of any class of the equity securities of the issuers mentioned in this report. Ninepoint Partners and/or its affiliates may hold short position in any class of the equity securities of the issuers mentioned in this report. During the preceding 12 months, Ninepoint Partners and/or its affiliates may have received remuneration other than normal course investment advisory or trade execution services from the issuers mentioned in this report.