Commentary
Print Print Subscribe

Ninepoint Global Infrastructure Fund

Global Infrastructure Fund - August 2024
Key Takeaways
  • Ninepoint Global Infrastructure Fund had a YTD return of 15.79% and a total return of 1.73% in August.
  • The S&P 500 and TSX Composite experienced volatility in early August but recovered later in the month. Chairman Powell's August 23 statement suggests that interest rate cuts are imminent and we expect three cuts of 25 basis points each through the end of the year.
  • Despite a robust economy, job growth is slowing, with August payrolls at 142,000 and unemployment at 4.2%. The Fed is monitoring labor market risks, and the forward curve suggests over 100 basis points of easing through the year.
  • The Fund is currently overweight the Energy and Real Estate sectors, while underweight the Industrials and Utilities sectors.
  • The Fund was concentrated in 30 positions and over the fiscal year 25 out of our 30 holdings have announced a dividend increase, with an average hike of 14.1%.

Monthly Update

Year-to-date to August 31, the Ninepoint Global Infrastructure Fund generated a total return of 15.79% compared to the MSCI World Core Infrastructure Index, which generated a total return of 12.34%. For the month, the Fund generated a total return of 1.73% while the Index generated a total return of 1.61%.

Ninepoint Global Infrastructure Fund - Compounded Returns¹ As of August 31, 2024 (Series F NPP356) | Inception Date: September 1, 2011

1M

YTD

3M

6M

1YR

3YR

5YR

10YR

Inception

Fund

1.7%

15.8%

4.1%

12.9%

18.7%

7.9%

8.1%

6.3%

7.9%

MSCI World Core Infrastructure NR (CAD)

1.6%

12.3%

7.9%

12.6%

17.8%

5.4%

5.4%

8.2%

10.8%

In August, the S&P 500 returned 2.3% and 2.4% on a total return basis while the TSX Composite returned 1.0% and 1.2% on a total return basis.  But these figures don’t quite capture the volatility that rocked the markets in early August, before a recovery occurred in the latter part of the month. We have discussed the drivers of the selloff previously, including the rotation out of the mega cap growth leaders, wildly fluctuating expectations regarding the upcoming US Presidential election, signs of a weakening US consumer, mixed results from some of the Mag7 stocks, a weak US nonfarm payroll report and a rapid unwind of the Yen carry trade. However, at the Jackson Hole Economic Symposium on August 23, Chairman Powell was quite clear, “The time has come for policy to adjust. The direction of travel is clear, and the timing and pace of rate cuts will depend on incoming data, the evolving outlook, and the balance of risk”. It is therefore almost certain that rate cuts will begin in September, and we expect that the most likely scenario will entail three cuts of 25 bps each through the balance of the year.

What happens in the equity markets after the first interest rate cut depends on the magnitude of the economic slowdown and the pace of job losses (basically the path depends on whether we get a hard or soft landing). Currently, economic growth remains robust, but the unemployment picture is softening, with the August payrolls coming in at 142,000 (and the unemployment rate at 4.2%) while the June and July jobs numbers were revised lower by a total of 86,000 jobs. Thankfully, the Fed has acknowledged the importance of monitoring the downside risks to the labour market and the forward curve is currently indicating slightly over 100 bps of easing through the balance of the year. Given the potential for higher volatility in the near term, we are planning to stay open-minded and nimble over the next couple of months.

Although September has started with another market wobble, at least recent earnings have been generally supportive, and with more than 99% of the S&P 500 companies having reported, 79% have reported a positive EPS surprise and 60% have reported a positive revenue surprise (according to FactSet). For Q2, the blended (actual and forecasted) year-over-year earnings growth rate of the S&P 500 is 11.3%, which marks the highest earnings growth rate since Q4 2021. Importantly, the outlook remains good for 2024 and 2025, with analysts expecting earnings growth of 10.1% and 15.0% respectively. Further, valuations have improved slightly, and the forward P/E ratio is approximately 20.6x, which is above the 5-year average of 19.4x and above the 10-year average of 18.0x but below the forward P/E ratio of 21.0x at the end of the second quarter of 2024 (again all according to FactSet). Looking forward, we expect that the earnings growth rates of mega cap tech and the rest of the market will narrow through the remainder of 2024, which should support broader participation as the rally eventually resumes its upward trend sometime in Q3 or Q4.

Given where we are in the cycle, we believe that the Fed will proceed with a series of 25 bps interest rate cuts through 2025 to orchestrate an economic soft-landing. Nevertheless, we are mildly worried that some of the recent data suggests that the US labour market may be softening faster than anticipated by the Fed. We are also nervous that the US Presidential election will create added uncertainty, which historically has caused volatility to pick up closer to November, much like the 2016 and 2020 election years. Despite these concerns, we are continually searching for companies that are expected to post solid revenue, earnings and dividend growth but still trade at acceptable valuations today.

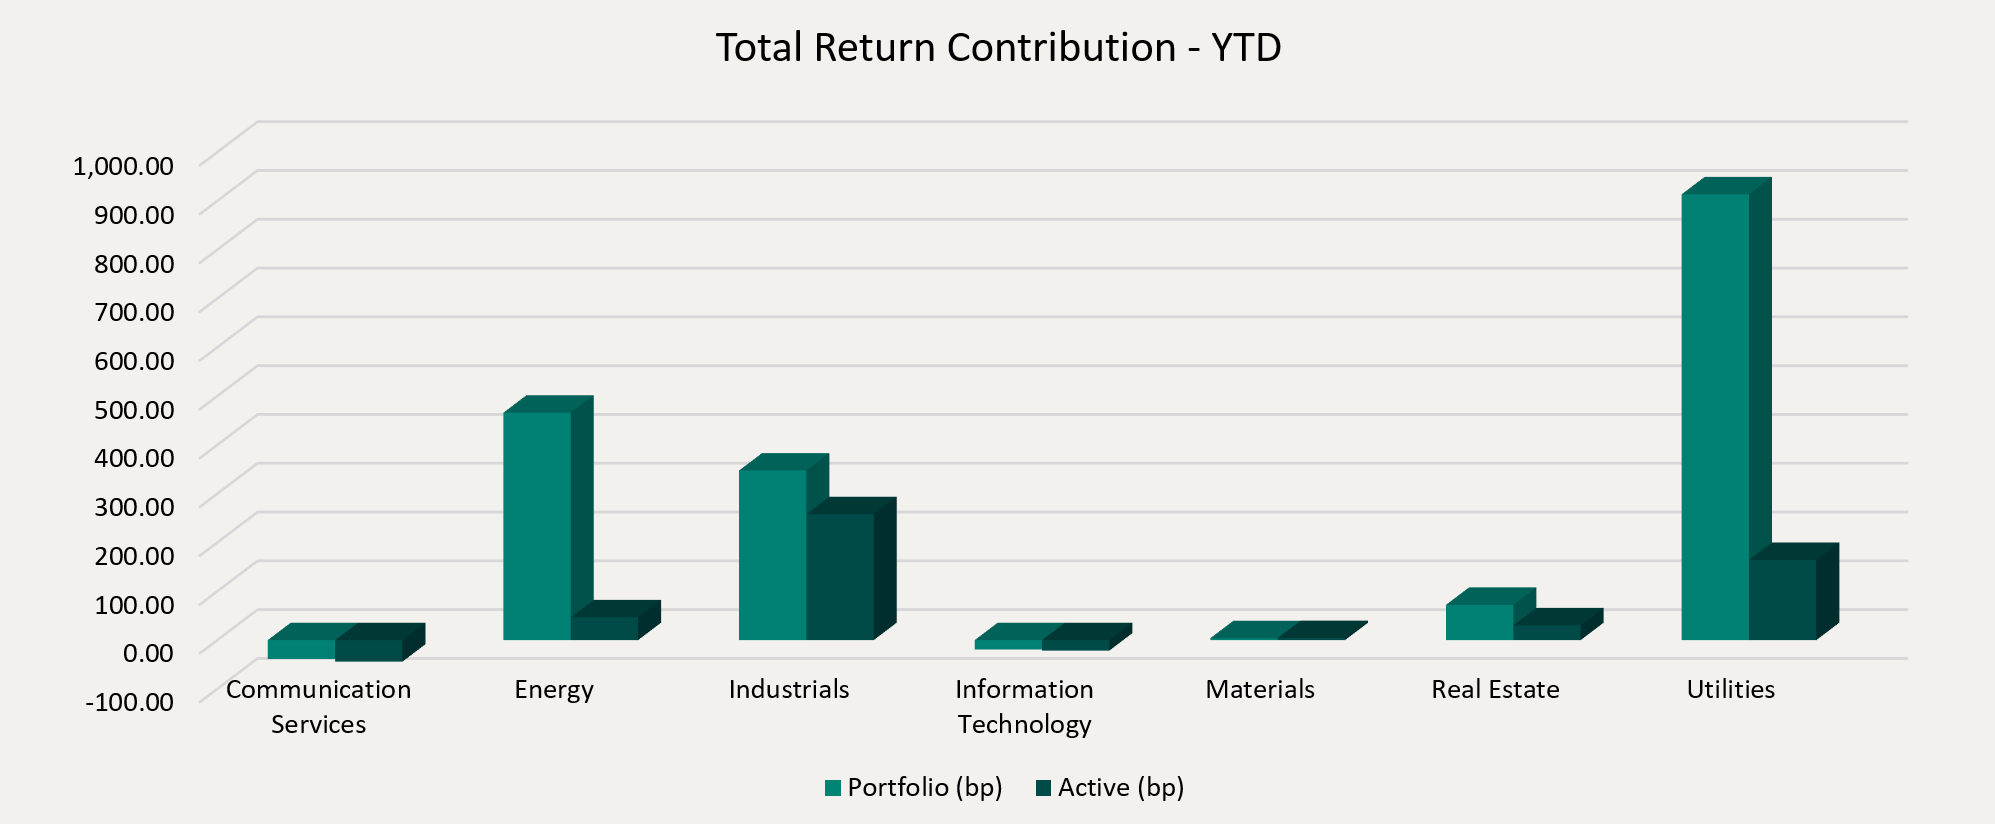
Top contributors to the year-to-date performance of the Ninepoint Global Infrastructure Fund by sector included Utilities (+914 bps), Energy (+466 bps) and Industrials (+348 bps), while top detractors by sector included Communication Services (-39 bps) and Information Technology (-19 bps) on an absolute basis.

On a relative basis, positive return contributions from the Industrials (+258 bps), Utilities (+164 bps) and Energy (+47 bps) sectors were offset by negative contributions from the Communication Services (-44 bps) and Information Technology (-21 bps) sectors.

Source: Ninepoint Partners

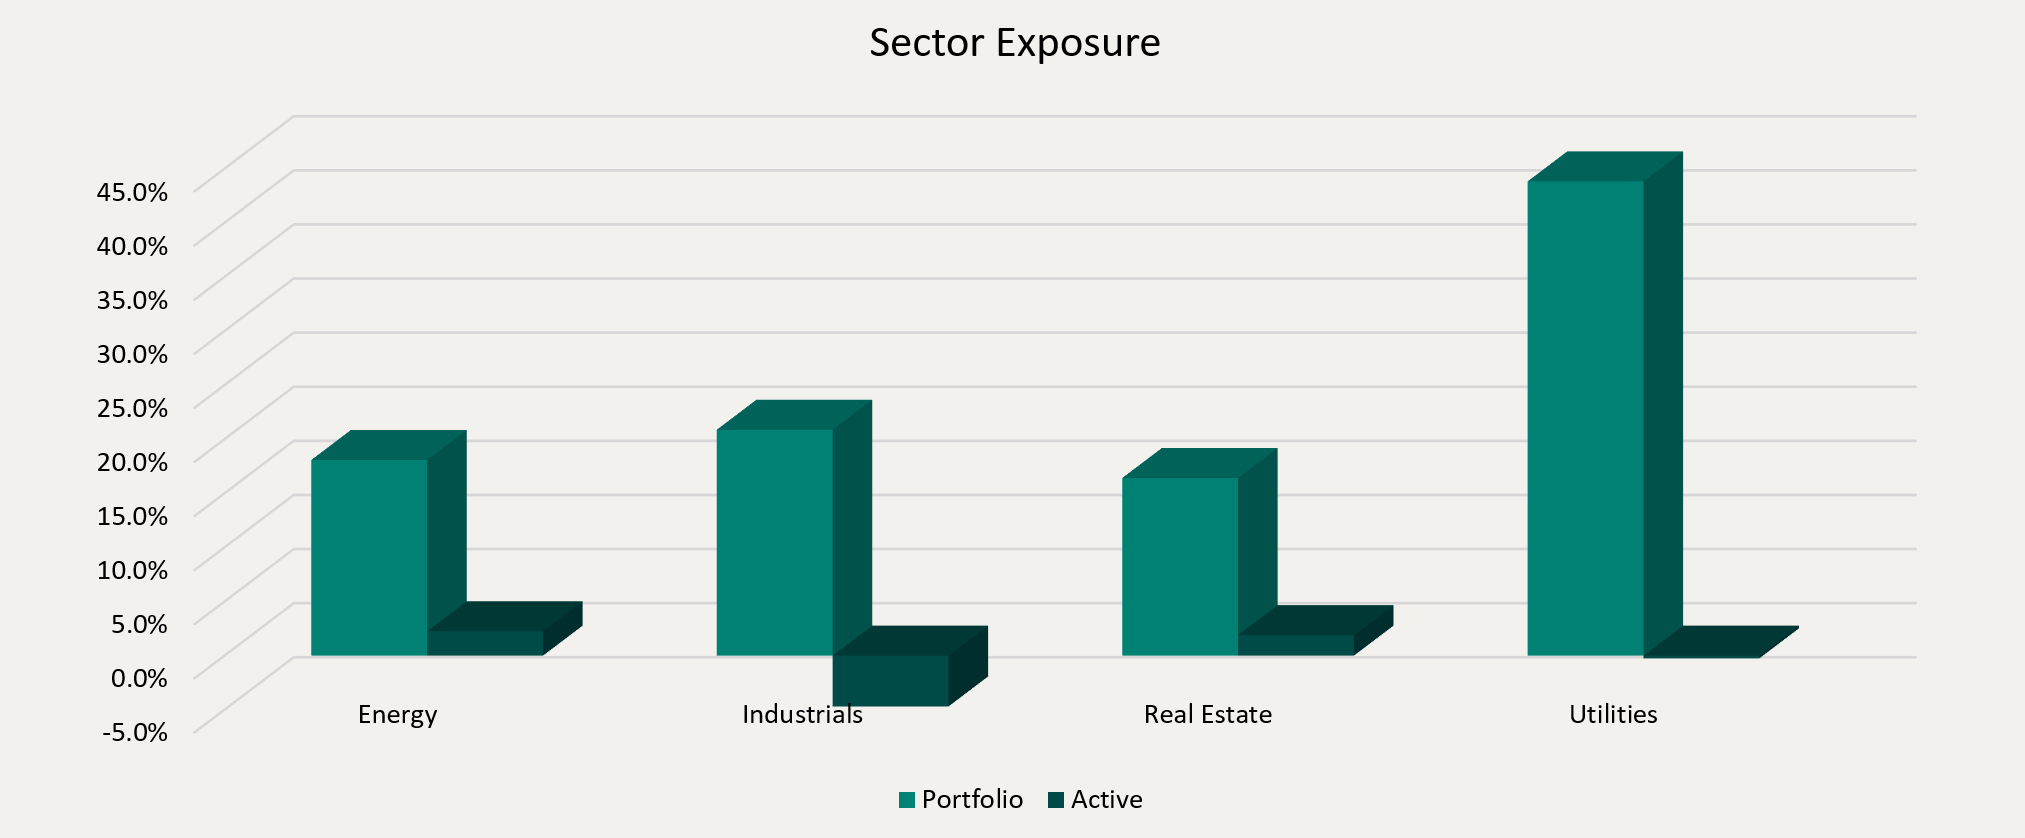
We are currently overweight the Energy and Real Estate sectors, while underweight the Utilities and Industrials sectors. As investors begin to assess the implications of the upcoming US Presidential election and the first interest rate cut of the cycle, are carefully watching the economic data to determine if the soft-landing scenario materializes. In the meantime, we remain focused on high quality, dividend paying infrastructure assets that have demonstrated the ability to consistently generate revenue and earnings growth through the business cycle.

We continue to believe that the clean energy transition will be one of the biggest investment themes for many years ahead. Therefore, we are comfortable having exposure to both traditional energy investments and renewable energy investments in the Ninepoint Global Infrastructure Fund given the importance of energy sustainability and security of supply around the world. Further, electricity demand is expected to accelerate dramatically, led data centers, manufacturing and transportation and we are looking to position the Fund to take advantage of this theme.

Sector Exposure
Source: Ninepoint Partners

The Ninepoint Global Infrastructure Fund was concentrated in 30 positions as at August 31, 2024 with the top 10 holdings accounting for approximately 39.4% of the fund. Over the prior fiscal year, 25 out of our 30 holdings have announced a dividend increase, with an average hike of 14.1% (median hike of 6.0%). Using a total infrastructure approach, we will continue to apply a disciplined investment process, balancing valuation, growth, and yield in an effort to generate solid risk-adjusted returns.

Jeffrey Sayer, CFA
Ninepoint Partners

1FactSet Earnings Insight

Historical Commentary

View All
  • Ninepoint Global Infrastructure Fund
    Year-to-date to September 30, the Ninepoint Global Infrastructure Fund generated a total return of 21.54% compared to the MSCI World Core Infrastructure Index, which generated a total return of 15.60%. For the month, the Fund generated a total return of 4.97% while the Index generated a total return of 2.90%.
    Infrastructure
  • Ninepoint Global Infrastructure Fund
    Year-to-date to July 31, the Ninepoint Global Infrastructure Fund generated a total return of 13.83% compared to the MSCI World Core Infrastructure Index, which generated a total return of 10.56%. For the month, the Fund generated a total return of 5.32% while the Index generated a total return of 7.82%.
    Infrastructure
  • Ninepoint Global Infrastructure Fund
    Year-to-date to June 30, the Ninepoint Global Infrastructure Fund generated a total return of 8.07% compared to the MSCI World Core Infrastructure Index, which generated a total return of 2.54%. For the month, the Fund generated a total return of -2.87% while the Index generated a total return of -1.53%.
    Infrastructure
  • Ninepoint Global Infrastructure Fund
    Year-to-date to May 31, the Ninepoint Global Infrastructure Fund generated a total return of 11.26% compared to the MSCI World Core Infrastructure Index, which generated a total return of 4.13%. For the month, the Fund generated a total return of 6.11% while the Index generated a total return of 4.00%.
    Infrastructure
  • Ninepoint Global Infrastructure Fund
    Year-to-date to April 30, the Ninepoint Global Infrastructure Fund generated a total return of 4.86% compared to the MSCI World Core Infrastructure Index, which generated a total return of 0.12%. For the month, the Fund generated a total return of -1.79% while the Index generated a total return of -2.29%.
    Infrastructure
  • Ninepoint Global Infrastructure Fund
    Year-to-date to March 31, the Ninepoint Global Infrastructure Fund generated a total return of 6.77% compared to the MSCI World Core Infrastructure Index, which generated a total return of 2.44%. For the month, the Fund generated a total return of 4.10% while the Index generated a total return of 2.66%.
    Infrastructure
  • Global Infrastructure Fund
    Year-to-date to February 29, the Ninepoint Global Infrastructure Fund generated a total return of 2.57% compared to the MSCI World Core Infrastructure Index, which generated a total return of -0.22. For the month, the Fund generated a total return of 4.08% while the Index generated a total return of 1.66%.
    Infrastructure
  • Global Infrastructure Fund
    Year-to-date to January 31, the Ninepoint Global Infrastructure Fund generated a total return of -1.45% compared to the MSCI World Core Infrastructure Index, which generated a total return of -1.84%. The year 2024 has started off much like 2023 ended, with stocks in the Communication and Information Technology sectors continuing to rally.
    Infrastructure

All returns and fund details are a) based on Series F units; b) net of fees; c) annualized if period is greater than one year; d) as at 8/31/2024; e) 2011 annual returns are from 09/01/11 to 12/31/11. The index is 100% MSCI World Core Infrastructure NR (CAD) and is computed by Ninepoint Partners LP based on publicly available index information.

The Fund is generally exposed to the following risks: Capital depletion risk; Concentration risk; Credit risk; Currency risk; Cybersecurity risk; Derivatives risk; Exchange traded funds risk; Foreign investment risk; Income trust risk; Inflation risk; Interest rate risk; Liquidity risk; Market risk; Regulatory risk; Securities lending, repurchase and reverse purchase transactions risk; Series risk; Short selling risk; Small company risk; Specific issuer risk; Tax risk.

Ninepoint Partners LP is the investment manager to the Ninepoint Funds (collectively, the “Funds”). Commissions, trailing commissions, management fees, performance fees (if any), other charges and expenses all may be associated with mutual fund investments. Please read the prospectus carefully before investing. The indicated rate of return for series F units of the Fund for the period ended 8/31/2024 is based on the historical annual compounded total return including changes in unit value and reinvestment of all distributions and does not take into account sales, redemption, distribution or optional charges or income taxes payable by any unitholder that would have reduced returns.  Mutual funds are not guaranteed, their values change frequently and past performance may not be repeated. The information contained herein does not constitute an offer or solicitation by anyone in the United States or in any other jurisdiction in which such an offer or solicitation is not authorized or to any person to whom it is unlawful to make such an offer or solicitation. Prospective investors who are not resident in Canada should contact their financial advisor to determine whether securities of the Fund may be lawfully sold in their jurisdiction.

The opinions, estimates and projections (“information”) contained within this report are solely those of Ninepoint Partners LP and are subject to change without notice. Ninepoint Partners makes every effort to ensure that the information has been derived from sources believed to be reliable and accurate. However, Ninepoint Partners assumes no responsibility for any losses or damages, whether direct or indirect, which arise out of the use of this information. Ninepoint Partners is not under any obligation to update or keep current the information contained herein. The information should not be regarded by recipients as a substitute for the exercise of their own judgment. Please contact your own personal advisor on your particular circumstances.

Views expressed regarding a particular company, security, industry or market sector should not be considered an indication of trading intent of any investment funds managed by Ninepoint Partners. Any reference to a particular company is for illustrative purposes only and should not to be considered as investment advice or a recommendation to buy or sell nor should it be considered as an indication of how the portfolio of any investment fund managed by Ninepoint Partners is or will be invested.

Ninepoint Partners LP and/or its affiliates may collectively beneficially own/control 1% or more of any class of the equity securities of the issuers mentioned in this report. Ninepoint Partners LP and/or its affiliates may hold short position in any class of the equity securities of the issuers mentioned in this report. During the preceding 12 months, Ninepoint Partners LP and/or its affiliates may have received remuneration other than normal course investment advisory or trade execution services from the issuers mentioned in this report.