Commentary
Print Print

Focused Global Dividend Fund

Focused Global Dividend Fund - November 2024
Key Takeaways
  • The Ninepoint Focused Global Dividend Fund outperformed the S&P Global 1200 Index year-to-date, returning 31.73% YTD vs. 29.76%.
  • 2024 was a strong year for equities, with the S&P 500 (+25.0% total return), NASDAQ (+29.6% total return), and TSX (+21.7% total return) posting solid gains.
  • December market weakness stemmed from the Federal Reserve’s “hawkish cut,” reducing 2025 rate cut expectations from four to two.
  • We are currently overweight the Financials, Industrials, and Consumer Staples sectors, while underweight the Health Care, Materials, and Utilities sectors.

Monthly Update

Year-to-date to December 31, the Ninepoint Focused Global Dividend Fund generated a total return of 31.73% compared to the S&P Global 1200 Index, which generated a total return of 29.76%. For the month, the Fund generated a total return of 0.27% while the Index generated a total return of 0.31%.

Ninepoint Focused Global Dividend Fund - Compounded Returns¹ As of December 30, 2024 (Series F NPP964) | Inception Date: November 25, 2015

1M

YTD

3M

6M

1YR

3YR

5YR

Inception

Fund

0.27%

31.73%

10.21%

13.74%

31.73%

11.26%

12.16%

9.88%

S&P Global 1200 TR (CAD)

0.31%

29.76%

5.86%

11.15%

29.76%

11.60%

13.72%

12.32%

It was another excellent year for equities (and most other asset classes), with the S&P 500 posting a +23.3% return (+25.0% on a total return basis), making it two years of +20% returns in a row. The Dow Jones Industrial Average posted a +12.9% return (+15.0% on a total return basis) but, once again, the tech-heavy NASDAQ led the pack and posted a +28.6% return (+29.6% on a total return basis). For Canadian domestic investors, the TSX posted a +18.0% return (+21.7% on a total return basis), which was a relatively decent performance. Broadly speaking, US stocks outperformed international stocks, large caps outperformed small caps and growth outperformed value, consistent with the trends of the past several years. Crude oil was essentially flat for the year, most bond indexes posted positive returns and both gold and bitcoin posted significant gains.

The only minor disappointment of 2024 was the failure of a Santa Claus rally to materialize over the last five trading days of the year. We know that we can’t really complain about much in 2024, but we did observe some weakness through the back half of December that was masked at the index level by strong year end performance of the Magnificent 7 stocks. We would attribute much of the underlying weakness to the US Federal Reserve and the “hawkish cut” on December 18th, when the FOMC cut the target interest rate by 25 basis points to a range of 4.25% to 4.50%. However, the ensuing press conference and the details contained in the Summary of Economic Projections seemed far less dovish than prior meetings, with only two interest rate cuts now forecasted in 2025, down from four cuts. We would point out that market expectations were already there, with the forward curve pricing in only two interest rate cuts in 2025 several months ahead of the final Fed meeting of 2024.

We remain focused on high quality, dividend payers that have demonstrated the ability to consistently generate revenue and earnings growth through the business cycle.

We do wonder if at least some of the hawkish shift was in anticipation of President Trump and his incoming administration’s policies (primarily aggressive fiscal spending and tariffs on foreign-produced goods) that could be largely inflationary. However, we are not convinced that resurgent inflation is lurking around the corner, since some of the President-elect’s policies may prove to be deflationary, and it remains to be seen what will ultimately be enacted. Unfortunately, this change in tone from the Fed was frustrating for many investors, since Chairman Powell had previously taken great pains to highlight his (backward-looking) data dependency.

In any case, the market impact was largely in line with our prior views: if interest rate cuts came in below expectations (implying fewer cuts than expected), large cap growth would outperform but if interest rate cuts came in above expectations (implying more cuts than expected) a rotation from growth to value would occur. As of today, this much anticipated rotation from growth to value has not persisted for longer than a few months at a time but in 2025, as earnings growth rates begin to converge for growth and value stocks, it is possible that we could see better relative performance from value. In the meantime, generally lower interest rates remain supportive for the equity markets as long as the economic data does not deteriorate significantly from here.

Into 2025, we are optimistic for continued positive equity performance and the underlying weakness in December offers a better setup for the year. However, we are mindful that volatility around inauguration day and the potential for portfolio rebalancing during Q1 could create some weakness at the index level. Again, we think that the growth rate differential between the Mag7 and the rest of the market should narrow in 2025, which could support a more lasting rotation from growth to value stocks. Importantly, with S&P 500 consensus earnings estimates rising through 2024, and currently at approximately $280 for 2025 and approximately $305 for 2026 (according to LSEG), we still think equity markets can post solid gains in 2025.

Top contributors to the year-to-date performance of the Ninepoint Focused Global Dividend Fund by sector included Information Technology (+929 bps), Industrials (+523 bps) and Consumer Staples (+446 bps), while only the Materials (-28 bps) sector detracted from performance on an absolute basis.

On a relative basis, positive return contributions from the Consumer Staples (+378 bps), Industrials (+316 bps) and Utilities (+63 bps) sectors were offset by negative contributions from the Financials (-392 bps), Information Technology (-193 bps) and Health Care (-98 bps) sectors.
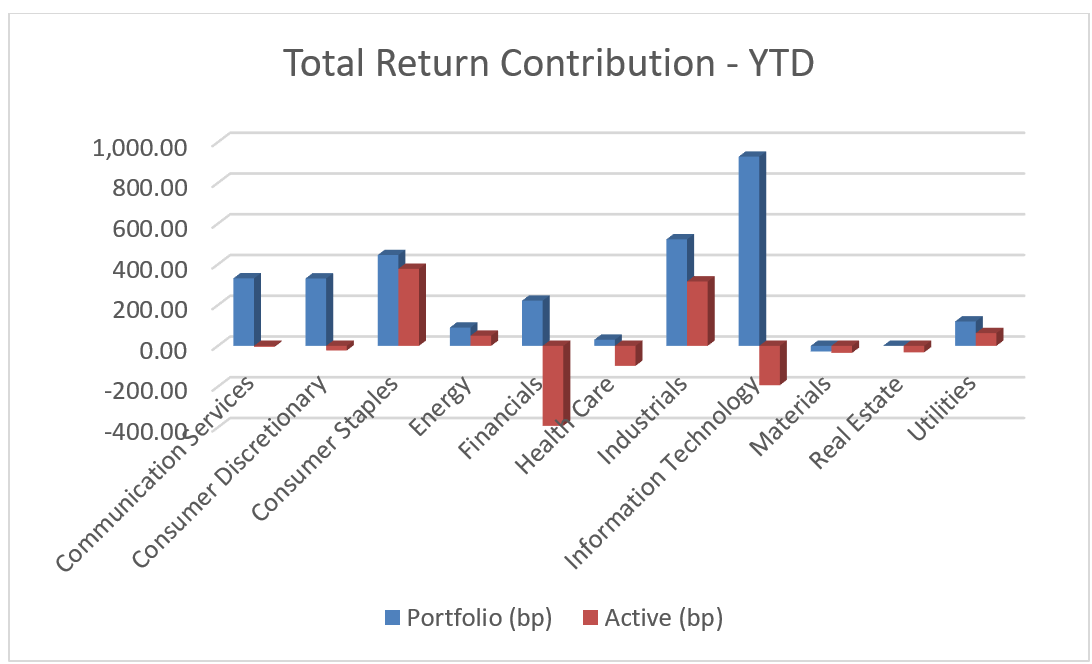
Total Return Contribution - YTD
Source: Ninepoint Partners

We are currently overweight the Financials, Industrials and Consumer Staples sectors, while underweight the Health Care, Materials and Utilities sectors. As we approach inauguration day, we will be carefully watching for policy announcements from the incoming President’s administration and the potential impact on growth and inflation expectations. Although we are optimistic about 2025, the key question for the equity markets will be whether President Trump’s policies prove significantly inflationary, thus creating a spike in bond yields. In the meantime, we remain focused on high quality, dividend payers that have demonstrated the ability to consistently generate revenue and earnings growth through the business cycle.
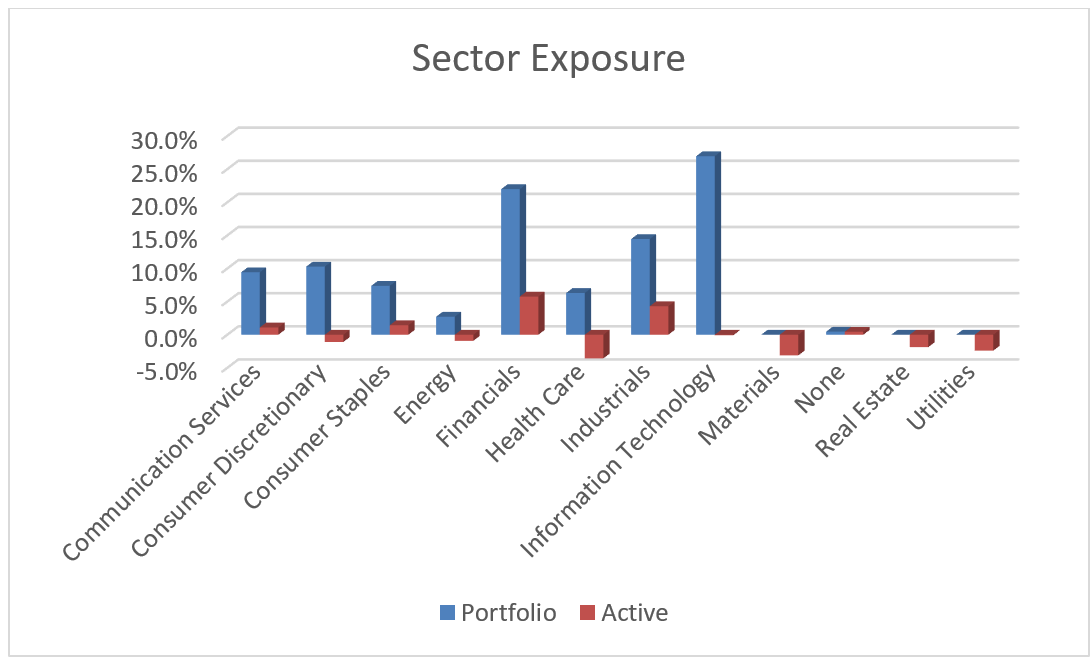
Sector Exposure
Source: Ninepoint Partners

The Ninepoint Focused Global Dividend Fund was concentrated in 30 positions as at December 31, 2024 with the top 10 holdings accounting for approximately 39.7% of the fund.  Over the prior fiscal year, 23 out of our 30 holdings have announced a dividend increase, with an average hike of 34.6% (median hike of 6.3%). We will continue to apply a disciplined investment process, balancing various quality and valuation metrics, in an effort to generate solid risk-adjusted returns.

Jeffery Sayer, CFA
Ninepoint Partners

Historical Commentary

View All
  • Focused Global Dividend Fund
    Year-to-date to November 30, the Ninepoint Focused Global Dividend Fund generated a total return of 31.37% compared to the S&P Global 1200 Index, which generated a total return of 29.36%. For the month, the Fund generated a total return of 7.19% while the Index generated a total return of 4.30%.
    Sector Investments
  • Ninepoint Focused Global Dividend Fund
    Year-to-date to October 31, the Ninepoint Focused Global Dividend Fund generated a total return of 22.56% compared to the S&P Global 1200 Index, which generated a total return of 24.03%. For the month, the Fund generated a total return of 2.54% while the Index generated a total return of 1.19%.
    Sector Investments
  • Ninepoint Focused Global Dividend Fund
    Year-to-date to September 30, the Ninepoint Focused Global Dividend Fund generated a total return of 19.52% compared to the S&P Global 1200 Index, which generated a total return of 22.57%. For the month, the Fund generated a total return of 0.92% while the Index generated a total return of 2.27%.
    Sector Investments
  • Ninepoint Focused Global Dividend Fund
    Year-to-date to August 31, the Ninepoint Focused Global Dividend Fund generated a total return of 18.43% compared to the S&P Global 1200 Index, which generated a total return of 19.86%. For the month, the Fund generated a total return of 0.23% while the Index generated a total return of 0.01%.
    Sector Investments
  • Ninepoint Focused Global Dividend Fund
    Year-to-date to July 31, the Ninepoint Focused Global Dividend Fund generated a total return of 18.16% compared to the S&P Global 1200 Index, which generated a total return of 19.84%. For the month, the Fund generated a total return of 2.02% while the Index generated a total return of 2.66%.
    Sector Investments
  • Ninepoint Focused Global Dividend Fund
    Year-to-date to June 30, the Ninepoint Focused Global Dividend Fund generated a total return of 15.82% compared to the S&P Global 1200 Index, which generated a total return of 16.74%. For the month, the Fund generated a total return of 4.05% while the Index generated a total return of 2.63%.
    Sector Investments
  • Focused Global Dividend Fund
    Year-to-date to May 31, the Ninepoint Focused Global Dividend Fund generated a total return of 11.31% compared to the S&P Global 1200 Index, which generated a total return of 13.75%. For the month, the Fund generated a total return of 2.81% while the Index generated a total return of 3.76%.
    Sector Investments
  • Focused Global Dividend Fund
    Year-to-date to April 30, the Ninepoint Focused Global Dividend Fund generated a total return of 8.26% compared to the S&P Global 1200 Index, which generated a total return of 9.62%. For the month, the Fund generated a total return of -1.28% while the Index generated a total return of -2.07%.
    Sector Investments
  • Ninepoint Focused Global Dividend Fund
    Year-to-date to March 31, the Ninepoint Focused Global Dividend Fund generated a total return of 9.67% compared to the S&P Global 1200 Index, which generated a total return of 11.94%. For the month, the Fund generated a total return of 1.13% while the Index generated a total return of 3.25%.
    Sector Investments
  • Focused Global Dividend Fund
    Year-to-date to January 31, the Ninepoint Focused Global Dividend Fund generated a total return of 2.87% compared to the S&P Global 1200 Index, which generated a total return of 2.26%. The year 2024 has started off much like 2023 ended, with stocks in the Communication and Information Technology sectors continuing to rally. However, after peaking last October and falling through the end of the year, the US 10-year Treasury bond yield retraced some of its recent move lower this past month.
    Sector Investments
  • Ninepoint Focused Global Dividend Fund
    Ninepoint Focused Global Dividend Fund had a YTD return of 14.44% up to December 31, compared to the S&P Global 1200 Index's total return of 20.07%. In 2023, the Fed's focus was on tightening monetary conditions to combat inflation, which decreased from 9.1% in June 2022 to 3.1% in November 2023 after significant interest rate hikes.
    Sector Investments

All returns and fund details are a) based on Series F shares; b) net of fees; c) annualized if period is greater than one year; d) as at 12/31/2024; e) 2015 annual returns are from 11/25/15 to 12/31/15. The index is S&P GLOBAL 1200 TR (CAD) and is computed by Ninepoint Partners LP based on publicly available index information.

The Fund is generally exposed to the following risks: ADR risk; Capital depletion risk; Concentration risk; Credit risk; Currency risk; Cybersecurity risk; Derivatives risk; Exchange traded funds risk; Foreign investment risk; Inflation risk; Interest rate risk; Liquidity risk; Market risk; Rule 144A and other exempted securities risk; Securities lending, repurchase and reverse repurchase transactions risk; Series risk; Short selling risk; Specific issuer risk; Tax risk.

Ninepoint Partners LP is the investment manager to the Ninepoint Funds (collectively, the “Funds”). Commissions, trailing commissions, management fees, performance fees (if any), and other expenses all may be associated with investing in the Funds. Please read the prospectus carefully before investing. The indicated rate of return for series F shares of the Fund for the period ended 12/31/2024 is based on the historical annual compounded total return including changes in share value and reinvestment of all distributions and does not take into account sales, redemption, distribution or optional charges or income taxes payable by any unitholder that would have reduced returns. Mutual funds are not guaranteed, their values change frequently and past performance may not be repeated. The information contained herein does not constitute an offer or solicitation by anyone in the United States or in any other jurisdiction in which such an offer or solicitation is not authorized or to any person to whom it is unlawful to make such an offer or solicitation. Prospective investors who are not resident in Canada should contact their financial advisor to determine whether securities of the Fund may be lawfully sold in their jurisdiction.

The opinions, estimates and projections (“information”) contained within this report are solely those of Ninepoint Partners LP and are subject to change without notice. Ninepoint Partners makes every effort to ensure that the information has been derived from sources believed to be reliable and accurate. However, Ninepoint Partners assumes no responsibility for any losses or damages, whether direct or indirect, which arise out of the use of this information. Ninepoint Partners is not under any obligation to update or keep current the information contained herein. The information should not be regarded by recipients as a substitute for the exercise of their own judgment. Please contact your own personal advisor on your particular circumstances.

Views expressed regarding a particular company, security, industry or market sector should not be considered an indication of trading intent of any investment funds managed by Ninepoint Partners LP. Any reference to a particular company is for illustrative purposes only and should not to be considered as investment advice or a recommendation to buy or sell nor should it be considered as an indication of how the portfolio of any investment fund managed by Ninepoint Partners LP is or will be invested.

Ninepoint Partners LP and/ or its affiliates may collectively beneficially own/control 1% or more of any class of the equity securities of the issuers mentioned in this report. Ninepoint Partners LP and/or its affiliates may hold short position in any class of the equity securities of the issuers mentioned in this report. During the preceding 12 months, Ninepoint Partners LP and/or its affiliates may have received remuneration other than normal course investment advisory or trade execution services from the issuers mentioned in this report.