Commentary
Print Print Subscribe

Ninepoint Global Infrastructure Fund

Ninepoint Global Infrastructure Fund January 2025
Key Takeaways
  • The Ninepoint Global Infrastructure Fund generated a total return of 4.49% compared to the MSCI World Core Infrastructure Index, which generated a total return of 2.42%.
  • Economic Outlook: Strong earnings growth (16.4% YoY), with optimism for positive equity performance in 2025 and solid gains despite expected volatility.
  • We are currently overweight the Energy and Real Estate sectors and slightly underweight the Industrials and Utilities sectors.

Monthly Update

Year-to-date to January 31, the Ninepoint Global Infrastructure Fund generated a total return of 4.49% compared to the MSCI World Core Infrastructure Index, which generated a total return of 2.42%.

Ninepoint Global Infrastructure Fund - Compounded Returns¹ As of January 31, 2025 (Series F NPP356) | Inception Date: September 1, 2011

1M

YTD

3M

6M

1YR

3YR

5YR

10YR

Inception

Fund

4.5%

4.5%

5.7%

15.1%

33.0%

12.3%

9.1%

7.6%

8.7%

MSCI World Core Infrastructure NR (CAD)

2.4%

2.4%

2.0%

6.8%

20.3%

6.7%

5.0%

7.2%

10.9%

Despite a weak December (specifically post Fed meeting), 2024 was an excellent year for stocks and it felt much less volatile than most years because of the steady gains.  However, with President Trump’s inauguration and his new administration now in Washington, it made sense to prepare for greater volatility as a slew of Presidential Executive Orders looked set to hit the tape. The final week of January somehow managed to surpass our expectations for greater volatility, with the introduction of DeepSeek to the world, a Fed meeting where they paused monetary policy easing and a US-instigated trade war with everyone from its closest neighbors and allies to its largest adversaries.

DeepSeek, the Chinese AI company that develops open-source large language models, was shocking since it appeared to perform nearly as well as existing AI models from OpenAI (the developer of ChatGPT) for a fraction of the cost. This called into question the entire AI-trade that had captivated investors through 2024, hitting everyone from semiconductor manufacturers, industrial and electrical equipment manufacturers, data center operators and even power producers. However, upon greater analysis and reflection, DeepSeek works well enough but is likely a mix of incomplete accounting, intellectual property theft and outright propaganda. It does serve as a stark reminder that technology always becomes better, cheaper and more efficient over time. We doubt that any US-based company will be able to integrate or monetize the use of DeepSeek and we have already seen attempts to ban or block the chatbot. Further, the US-based hyperscalers will continue to spend almost unbelievable amounts to maintain their technological advantage and therefore we think that the AI-trade is far from over.

Finally, on the last Friday of January, we began hearing rumblings of Trump’s strategy of instigating a trade war to achieve his egocentric worldview.

The second major catalyst was the US FOMC meeting on January 29, where the Fed refrained from lowering interest rates after cutting a total of 100 bps over the prior three meetings. This should not have been a surprise to anyone after the December FOMC meeting, given comments suggesting that several members of the FOMC were concerned about the impact of future fiscal policies (which should be interpreted as the threat of tariffs) on the growth and inflation outlook. There were a few minutes of concern after the release of the statement when some pointed out the removal of the phrase “…has made progress toward the Committee’s 2 percent objective…” (regarding inflation) but Powell quickly confirmed in the press conference that they were just “cleaning up” the language. Today, based on the interest rate forward curve, the market is expecting one or two more cuts in 2025, likely around July and December, and we broadly agree with this assessment.

Finally, on the last Friday of January, we began hearing rumblings of Trump’s strategy of instigating a trade war to achieve his egocentric worldview. Word spread that he was about to slap 25% tariffs on his two closest trading partners, Canada and Mexico, and 10% additional tariffs on China to right past perceived wrongs, improve border security, reduce the flow of fentanyl, incentivize industrial onshoring, fix trade imbalances, boost defense spending and whatever other goals he could come up with. Clearly, the world is more complicated than he understands it to be and the adverse market reaction, across equities, fixed income and currencies signalled how misguided he is. Thankfully, Mexico and Canada received a temporary reprieve from the tariffs after high-level calls with the President of Mexico and the Prime Minister of Canada on the following Monday. But this should serve as a reminder that President Trump would likely want to annex our country if given half a chance and, as Canadians, we must unify to strongly oppose any policies that could weaken the bond between our two countries. We must also use this as a warning and look to strengthen our domestic economy, diversify our international trade network, build oil and gas export infrastructure and improve our standing globally so that we cannot be bullied into submission by our southern neighbour.

Beyond the wild week of (negative) macro catalysts, earnings, the biggest factor that drives stocks and the markets over the long-term, have been quite good. According to FactSet, with 62% of the S&P 500 companies having reported actual results, 63% of the companies have reported a positive revenue surprise and 77% of the companies have reported a positive EPS surprise. Currently, the blended year-over-year earnings growth rate for the S&P 500 is 16.4%, the highest year-over-year growth rate since Q4 2021. For 2025, we are optimistic for continued positive equity performance and volatility through the year will likely offer many investment opportunities. Importantly, with S&P 500 bottom-up consensus earnings estimates currently at approximately $272 for 2025 and approximately $309 for 2026 (according to FactSet), we think equity markets can still post solid gains in 2025.

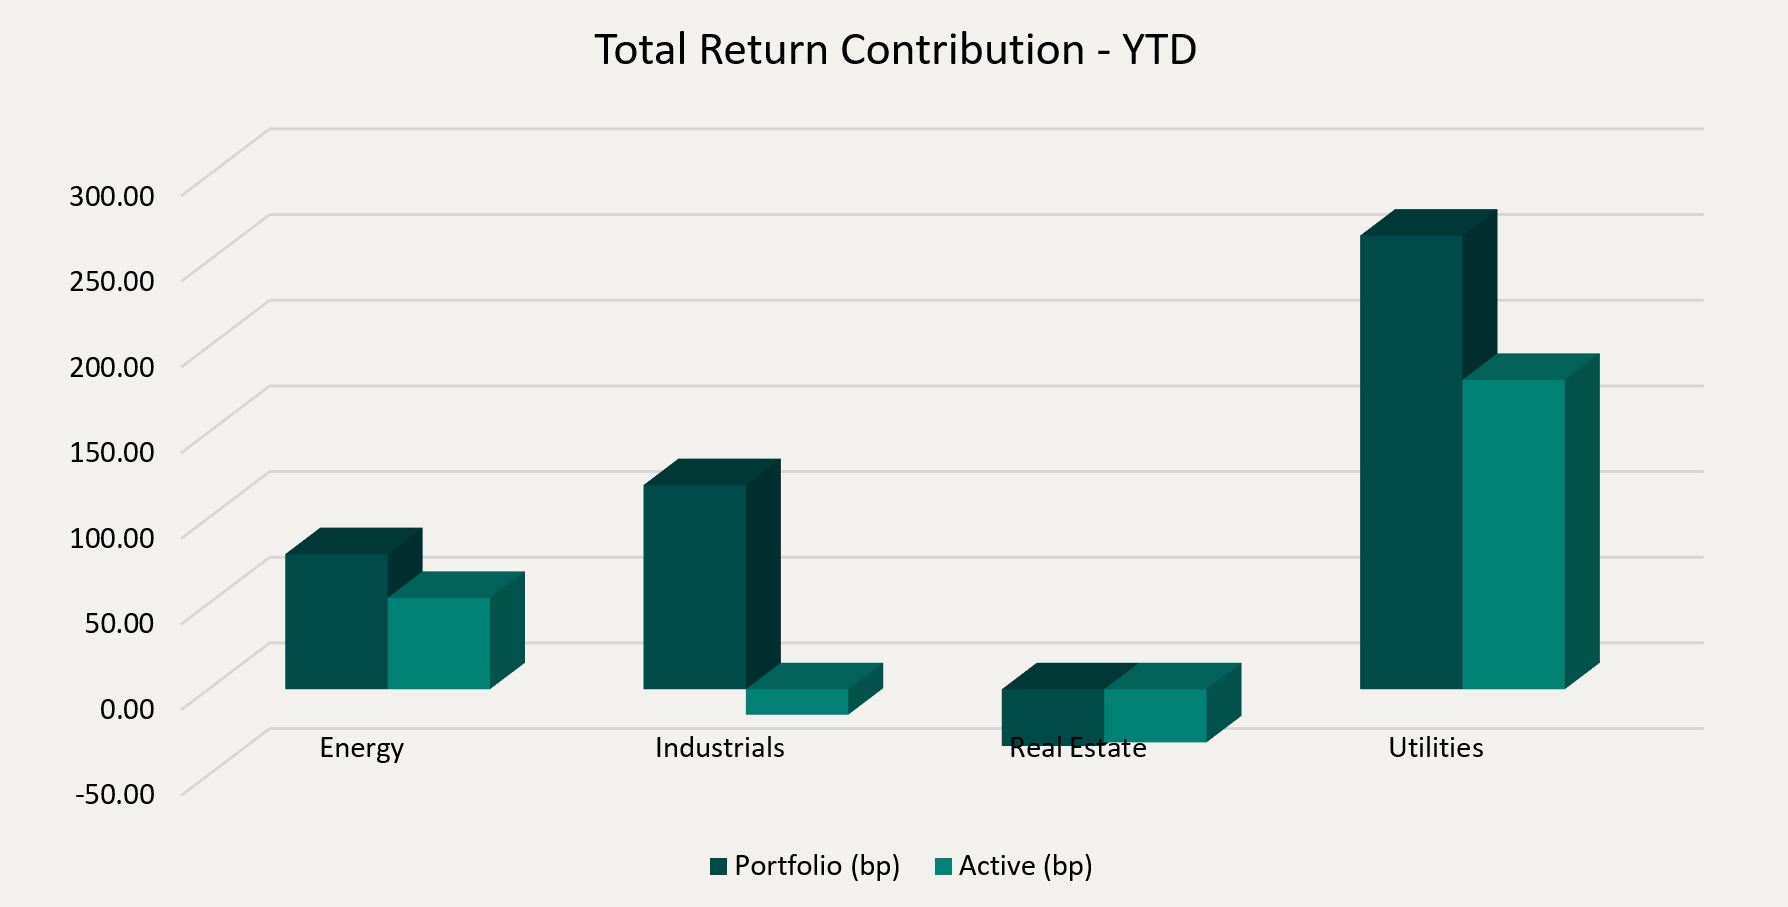
Top contributors to the year-to-date performance of the Ninepoint Global Infrastructure Fund by sector included Utilities (+265 bps), Industrials (+119 bps) and Energy (+79 bps), while only the Real Estate (-33 bps) sector detracted from performance on an absolute basis.

On a relative basis, positive return contributions from the Utilities (+181 bps) and Energy (+53 bps) were offset by negative contributions from the Real Estate (-31 bps) and Industrials (-15 bps) sectors.

Total Return Contribution - YTD
Source: Ninepoint Partners

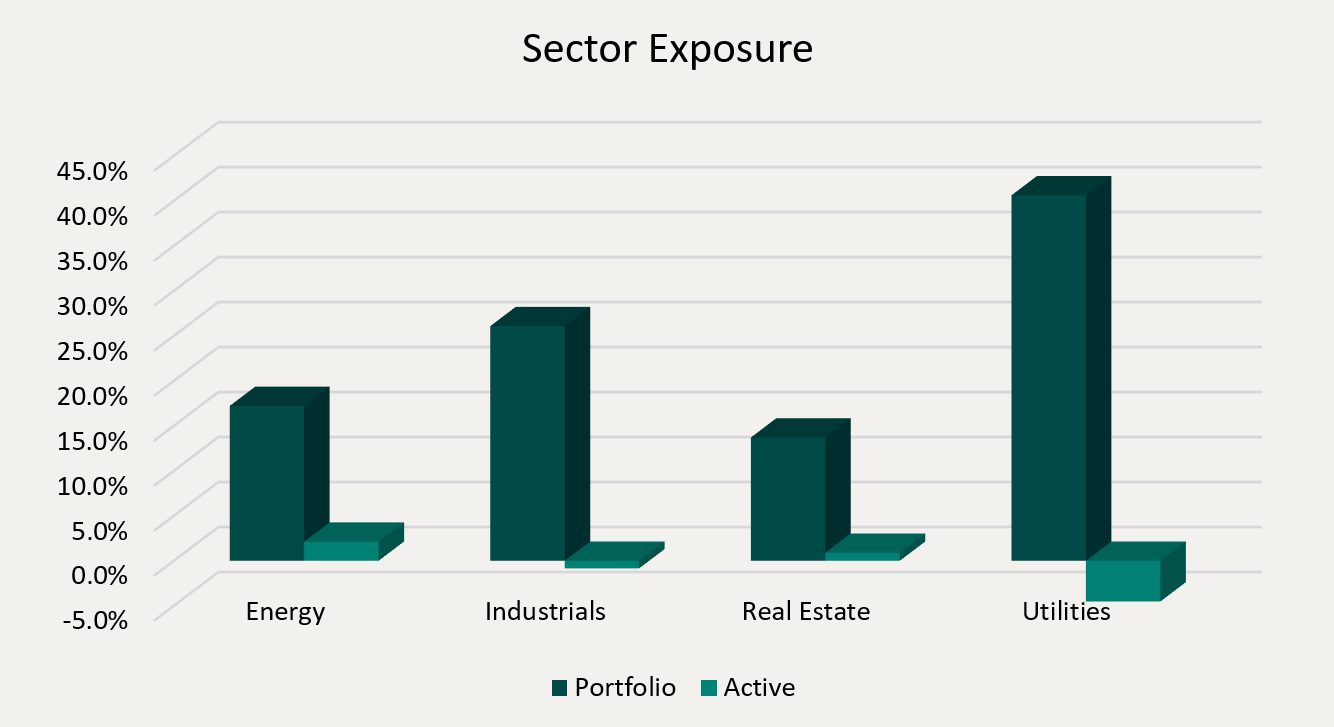
We are currently slightly overweight the Energy and Real Estate sectors and slightly underweight the Industrials and Utilities sectors. Just a few weeks into President Trump’s second term, policy announcements from his administration have already led to greater volatility in the equity, fixed income and currency markets. Although we are optimistic about 2025, the key question for the equity markets will be whether President Trump’s policies prove significantly inflationary, thus creating a spike in bond yields.

Finally, we continue to believe that the infrastructure asset class is ideally positioned to benefit from the Electrification of the US Economy investment theme and the related Energy Transition theme. Importantly, electricity demand is expected to accelerate dramatically, led primarily by the construction of AI-focused data centers and the onshoring of industrial manufacturing. Therefore, we are comfortable having exposure to various infrastructure sub-sectors or sub-industries in the Ninepoint Global Infrastructure Fund that are positioned to benefit from these themes, including traditional energy investments, and electrical, natural gas, nuclear or multi-utilities.

Sector Exposure
Source: Ninepoint Partners

The Ninepoint Global Infrastructure Fund was concentrated in 30 positions as at January 31, 2025 with the top 10 holdings accounting for approximately 37.6% of the fund. Over the prior fiscal year, 21 out of our 30 holdings have announced a dividend increase, with an average hike of 11.6% (median hike of 4.6%). Using a total infrastructure approach, we will continue to apply a disciplined investment process, balancing valuation, growth, and yield in an effort to generate solid risk-adjusted returns.

Jeffrey Sayer, CFA
Ninepoint Partners

Historical Commentary

View All
  • Ninepoint Global Infrastructure Fund
    Year-to-date to November 30, the Ninepoint Global Infrastructure Fund generated a total return of 31.75% compared to the MSCI World Core Infrastructure Index, which generated a total return of 20.46%. For the month, the Fund generated a total return of 6.25% while the Index generated a total return of 3.99%.
    Infrastructure
  • Ninepoint Global Infrastructure Fund
    Year-to-date to October 31, the Ninepoint Global Infrastructure Fund generated a total return of 24.00% compared to the MSCI World Core Infrastructure Index, which generated a total return of 15.84%. For the month, the Fund generated a total return of 2.02% while the Index generated a total return of 0.21%.
    Infrastructure
  • Ninepoint Global Infrastructure Fund
    Year-to-date to September 30, the Ninepoint Global Infrastructure Fund generated a total return of 21.54% compared to the MSCI World Core Infrastructure Index, which generated a total return of 15.60%. For the month, the Fund generated a total return of 4.97% while the Index generated a total return of 2.90%.
    Infrastructure
  • Ninepoint Global Infrastructure Fund
    Year-to-date to August 31, the Ninepoint Global Infrastructure Fund generated a total return of 15.79% compared to the MSCI World Core Infrastructure Index, which generated a total return of 12.34%. For the month, the Fund generated a total return of 1.73% while the Index generated a total return of 1.61%.
    Infrastructure
  • Ninepoint Global Infrastructure Fund
    Year-to-date to July 31, the Ninepoint Global Infrastructure Fund generated a total return of 13.83% compared to the MSCI World Core Infrastructure Index, which generated a total return of 10.56%. For the month, the Fund generated a total return of 5.32% while the Index generated a total return of 7.82%.
    Infrastructure
  • Ninepoint Global Infrastructure Fund
    Year-to-date to June 30, the Ninepoint Global Infrastructure Fund generated a total return of 8.07% compared to the MSCI World Core Infrastructure Index, which generated a total return of 2.54%. For the month, the Fund generated a total return of -2.87% while the Index generated a total return of -1.53%.
    Infrastructure
  • Ninepoint Global Infrastructure Fund
    Year-to-date to May 31, the Ninepoint Global Infrastructure Fund generated a total return of 11.26% compared to the MSCI World Core Infrastructure Index, which generated a total return of 4.13%. For the month, the Fund generated a total return of 6.11% while the Index generated a total return of 4.00%.
    Infrastructure
  • Ninepoint Global Infrastructure Fund
    Year-to-date to April 30, the Ninepoint Global Infrastructure Fund generated a total return of 4.86% compared to the MSCI World Core Infrastructure Index, which generated a total return of 0.12%. For the month, the Fund generated a total return of -1.79% while the Index generated a total return of -2.29%.
    Infrastructure
  • Ninepoint Global Infrastructure Fund
    Year-to-date to March 31, the Ninepoint Global Infrastructure Fund generated a total return of 6.77% compared to the MSCI World Core Infrastructure Index, which generated a total return of 2.44%. For the month, the Fund generated a total return of 4.10% while the Index generated a total return of 2.66%.
    Infrastructure
  • Global Infrastructure Fund
    Year-to-date to February 29, the Ninepoint Global Infrastructure Fund generated a total return of 2.57% compared to the MSCI World Core Infrastructure Index, which generated a total return of -0.22. For the month, the Fund generated a total return of 4.08% while the Index generated a total return of 1.66%.
    Infrastructure
  • Global Infrastructure Fund
    Year-to-date to January 31, the Ninepoint Global Infrastructure Fund generated a total return of -1.45% compared to the MSCI World Core Infrastructure Index, which generated a total return of -1.84%. The year 2024 has started off much like 2023 ended, with stocks in the Communication and Information Technology sectors continuing to rally.
    Infrastructure

All returns and fund details are a) based on Series F units; b) net of fees; c) annualized if period is greater than one year; d) as at 1/31/2025; e) 2011 annual returns are from 09/01/11 to 12/31/11. The index is 100% MSCI World Core Infrastructure NR (CAD) and is computed by Ninepoint Partners LP based on publicly available index information.

The Fund is generally exposed to the following risks: Capital depletion risk; Concentration risk; Credit risk; Currency risk; Cybersecurity risk; Derivatives risk; Exchange traded funds risk; Foreign investment risk; Income trust risk; Inflation risk; Interest rate risk; Liquidity risk; Market risk; Regulatory risk; Securities lending, repurchase and reverse purchase transactions risk; Series risk; Short selling risk; Small company risk; Specific issuer risk; Tax risk.

Ninepoint Partners LP is the investment manager to the Ninepoint Funds (collectively, the “Funds”). Commissions, trailing commissions, management fees, performance fees (if any), other charges and expenses all may be associated with mutual fund investments. Please read the prospectus carefully before investing. The indicated rate of return for series F units of the Fund for the period ended 1/31/2025 is based on the historical annual compounded total return including changes in unit value and reinvestment of all distributions and does not take into account sales, redemption, distribution or optional charges or income taxes payable by any unitholder that would have reduced returns.  Mutual funds are not guaranteed, their values change frequently and past performance may not be repeated. The information contained herein does not constitute an offer or solicitation by anyone in the United States or in any other jurisdiction in which such an offer or solicitation is not authorized or to any person to whom it is unlawful to make such an offer or solicitation. Prospective investors who are not resident in Canada should contact their financial advisor to determine whether securities of the Fund may be lawfully sold in their jurisdiction.

The opinions, estimates and projections (“information”) contained within this report are solely those of Ninepoint Partners LP and are subject to change without notice. Ninepoint Partners makes every effort to ensure that the information has been derived from sources believed to be reliable and accurate. However, Ninepoint Partners assumes no responsibility for any losses or damages, whether direct or indirect, which arise out of the use of this information. Ninepoint Partners is not under any obligation to update or keep current the information contained herein. The information should not be regarded by recipients as a substitute for the exercise of their own judgment. Please contact your own personal advisor on your particular circumstances.

Views expressed regarding a particular company, security, industry or market sector should not be considered an indication of trading intent of any investment funds managed by Ninepoint Partners. Any reference to a particular company is for illustrative purposes only and should not to be considered as investment advice or a recommendation to buy or sell nor should it be considered as an indication of how the portfolio of any investment fund managed by Ninepoint Partners is or will be invested.

Ninepoint Partners LP and/or its affiliates may collectively beneficially own/control 1% or more of any class of the equity securities of the issuers mentioned in this report. Ninepoint Partners LP and/or its affiliates may hold short position in any class of the equity securities of the issuers mentioned in this report. During the preceding 12 months, Ninepoint Partners LP and/or its affiliates may have received remuneration other than normal course investment advisory or trade execution services from the issuers mentioned in this report.