 February 28, 2025
Commentary


Monthly Update
Ninepoint Focused Global Dividend Fund - Compounded Returns¹ As of February 28, 2025 (Series F NPP964) | Inception Date: November 25, 2015
1M |
YTD |
3M |
6M |
1YR |
3YR |
5YR |
Inception |
|
|---|---|---|---|---|---|---|---|---|
Fund |
-3.02% |
0.97% |
1.24% |
12.31% |
22.64% |
14.20% |
13.26% |
9.81% |
S&P Global 1200 TR (CAD) |
-0.82% |
3.17% |
3.49% |
11.69% |
23.48% |
15.44% |
15.81% |
12.47% |
The euphoria after President Trump’s victory and hopes of “animal spirits” powering the North American markets to new highs based on a combination of lower taxes, deregulation and America-first policies have quickly faded. Early signs of a developing economic soft patch were exacerbated by the administration’s instigation of a global trade war premised on irrational arguments and questionable legality. Unfortunately, Trump’s strategy seems to rely on disruption and destabilization to meet his administration’s goals, which themselves are inherently conflicting and economically unsound. We’ve tried to put together a timeline for the selloff, that started on Thursday, February 20th and, as of writing, may not have completely stabilized.
On that Thursday, the consumer discretionary bellwether, Walmart, reported earnings pre-market with revenue coming in at $180.6 billion versus $180.0 billion expected (up 4.1% or 5.3% in constant currency, with US same store sales up 4.6%, the number of transactions up 2.8% and the average ticket up 1.8%). Although EPS was better than expected at $0.66 versus $0.64 (up 10%), guidance was weaker than expected. Management stated that FY 2026 constant currency net sales growth would come in at 3% to 4% versus 4% expected and that FY 2026 EPS would come in at $2.50 to $2.60 versus $2.76 expected. When the market opened that morning, WMT stock declined by high single digits, other consumer discretionary stocks fell in sympathy and many US bank stocks dropped by mid-single digits on the weaker outlook for the US consumer.1
Trump’s strategy seems to rely on disruption and destabilization to meet his administration’s goals, which themselves are inherently conflicting and economically unsound.
During market hours on Thursday, reports regarding US defense spending cuts began to circulate, with the Pentagon proposing 8% cuts to its budget in each over the next five years for $50 billion in annual savings. Defense stocks declined in a sharp knee-jerk reaction, including the retail-trader favourite Palantir (the CEO filing to sell over $1 billion worth of stock also likely didn’t help sentiment). More market moving news hit the tape later in the afternoon when a FERC (Federal Energy Regulatory Commission) open meeting led to the initiation of a new proceeding to review power co-location regulations. The proceeding allowed for 30 days for comments and a subsequent 30 days for reply comments, with the objective of finding a “just solution” while providing clarity as quickly as possible. However, the lack of an immediate decision was viewed as a negative data point for the incumbent independent power producers (IPPs) and raised the possibility that data centre developers would increasingly prefer to work with the regulated utilities. Consequently, stocks tied to the AI-focused data centre trade began to decline precipitously, which included the IPPs, various industrials and natural gas producers and pipelines.
On Friday before the market opened, news reports surfaced that the Department of Justice had launched an inquiry into UnitedHealth Group’s Medicare billing practices. We can’t comment on the potential outcome of the investigation, but UNH stock (a large component of the Dow Jones Industrial Average) declined by high single digits throughout the day. Next, flash PMI readings were released mid-morning for February, with the flash services PMI declining to 49.7 (a 25-month low) from 52.9, further calling into question the health of the US consumer. Finally, during the afternoon session, news reports called attention to an article in a scientific journal, written by a prominent researcher at the Wuhan Institute of Virology, identifying a new, potentially dangerous Covid strain. Unnerved investors were unwilling to hold stocks over the weekend and markets slid into the close.
Before the market opened on Monday, a sell-side report was published that claimed Microsoft had cancelled leases of about 200 MW of data centre capacity with two private data centre developers.2 Subsequent channel checks and an interview with Satya Nadella clarified that there had been no change to MSFT’s data centre strategy, that the Company still planned to spend $80 billion this year and had simply reallocated dollars based on a 10-year view of demand for cloud and AI computing. Importantly, 200 MW is only a small component of MSFT’s data centre's current capacity (approximately 5 GW), and the shift was likely driven by the lack of signed power agreements as opposed to weakening demand. MSFT also seemed to be shifting from long-cycle AI spending (building the data centres) to shorter-cycle spending (adding server racks, power and cooling to the facilities). But once again, MSFT stock and various other stocks tied to the AI-focused data centre trade continued to trade lower.
The next two days were relatively quiet, as investors waited for the main event of the week, Nvidia’s operating and financial results. But in the meantime, economic data showed that US consumer confidence declined 7% to a reading of 98.3, at least in part due to Trump suggesting that tariffs were going to be applied to imports from Canada and Mexico at 25% and 10% on energy on March 4th as planned. Investor excitement ramped up again on Wednesday night when, after much anticipation, Nvidia reported financial results that were exceptional but just not quite good enough relative to expectations.3 Revenue was $39.3 billion versus $38.0 billion expected (up 78% year-over-year) and EPS was $0.89 versus $0.84 (up 71% year-over-year). However, forward guidance was not the same blowout that investors had gotten used to, with management seeing Q1 2026 revenue of $43.0 billion (plus or minus 2%) versus $42.0 billion expected and gross margins declining from 73.0% in Q4 to 71.0% in Q1 (plus or minus 50 bps) due to the Blackwell ramp. After fluctuating up and down overnight and pre-market, shares of NVDA fell by high single digits during market hours on Thursday.
The key takeaway from the market reactions to this extensive list of both macroeconomic and company specific news is that uncertainty and volatility will be much higher over the next four years than over the past four years. The threat of tariffs applied to goods imported from Canada, Mexico and China to the United States will likely act as an overhang on investor sentiment, with potentially on-again/off-again announcements adding to the confusion for some time to come.
But it is important to remember that the long-term drivers of stock prices remain robust, with 2025 revenue expected to grow 5.5% and EPS expected to grow 12.1% (to roughly $271 for the S&P 500) and 2026 revenue expected to grow 6.5% and EPS expected to grow 14.0% (to roughly $309 for the S&P 500), according to FactSet. We would also point out that the interest rate forward curve is currently pricing in at least three cuts in 2025, likely occurring at the June, September and December FOMC meetings, which should offer some downside support if the outlook deteriorates. In this environment, we don’t want to panic, but we have reduced outsized allocations to individual stocks and investment themes while remaining invested in a diversified portfolio of dividend-paying, high-quality companies.
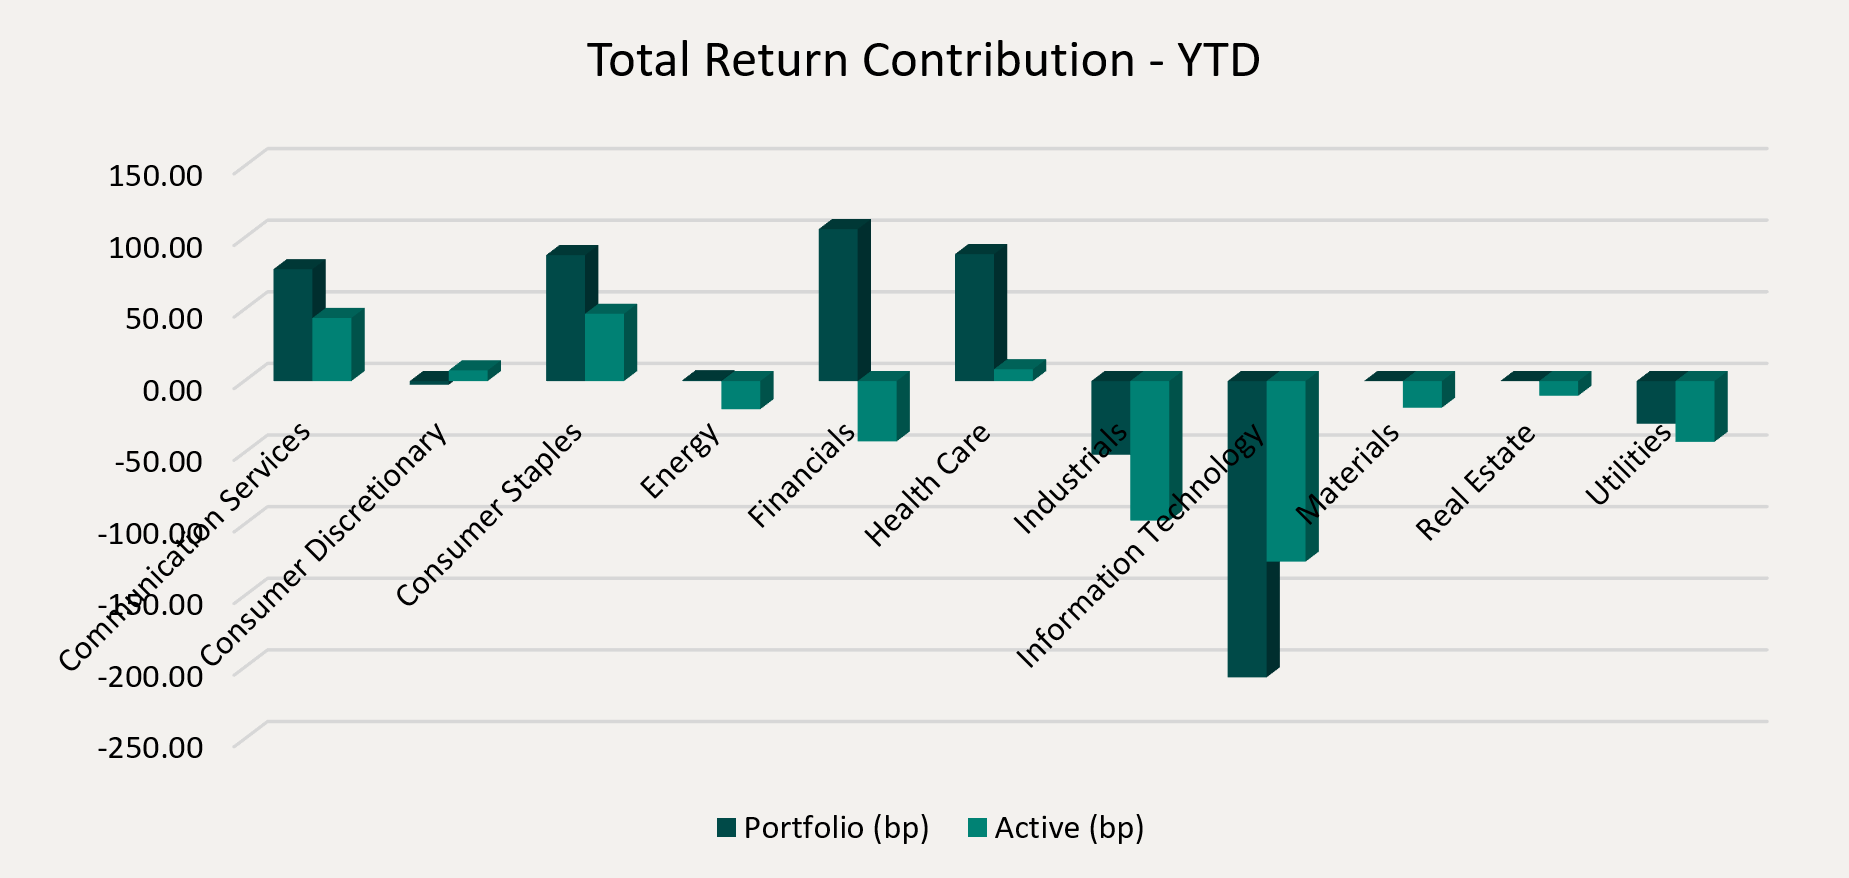
Top contributors to the year-to-date performance of the Ninepoint Focused Global Dividend Fund by sector included Financials (+106 bps), Health Care (+89 bps) and Consumer Staples (+88 bps), while the Information Technology (-207 bps), Industrials (-51 bps) and Utilities (-30 bps) sectors detracted from performance on an absolute basis.
On a relative basis, positive return contributions from the Consumer Staples (+47 bps), Communication (+44 bps) and Health Care (+8 bps) sectors were offset by negative contributions from the Information Technology (-126 bps), Industrials (-97 bps) and Utilities (-42 bps) sectors.
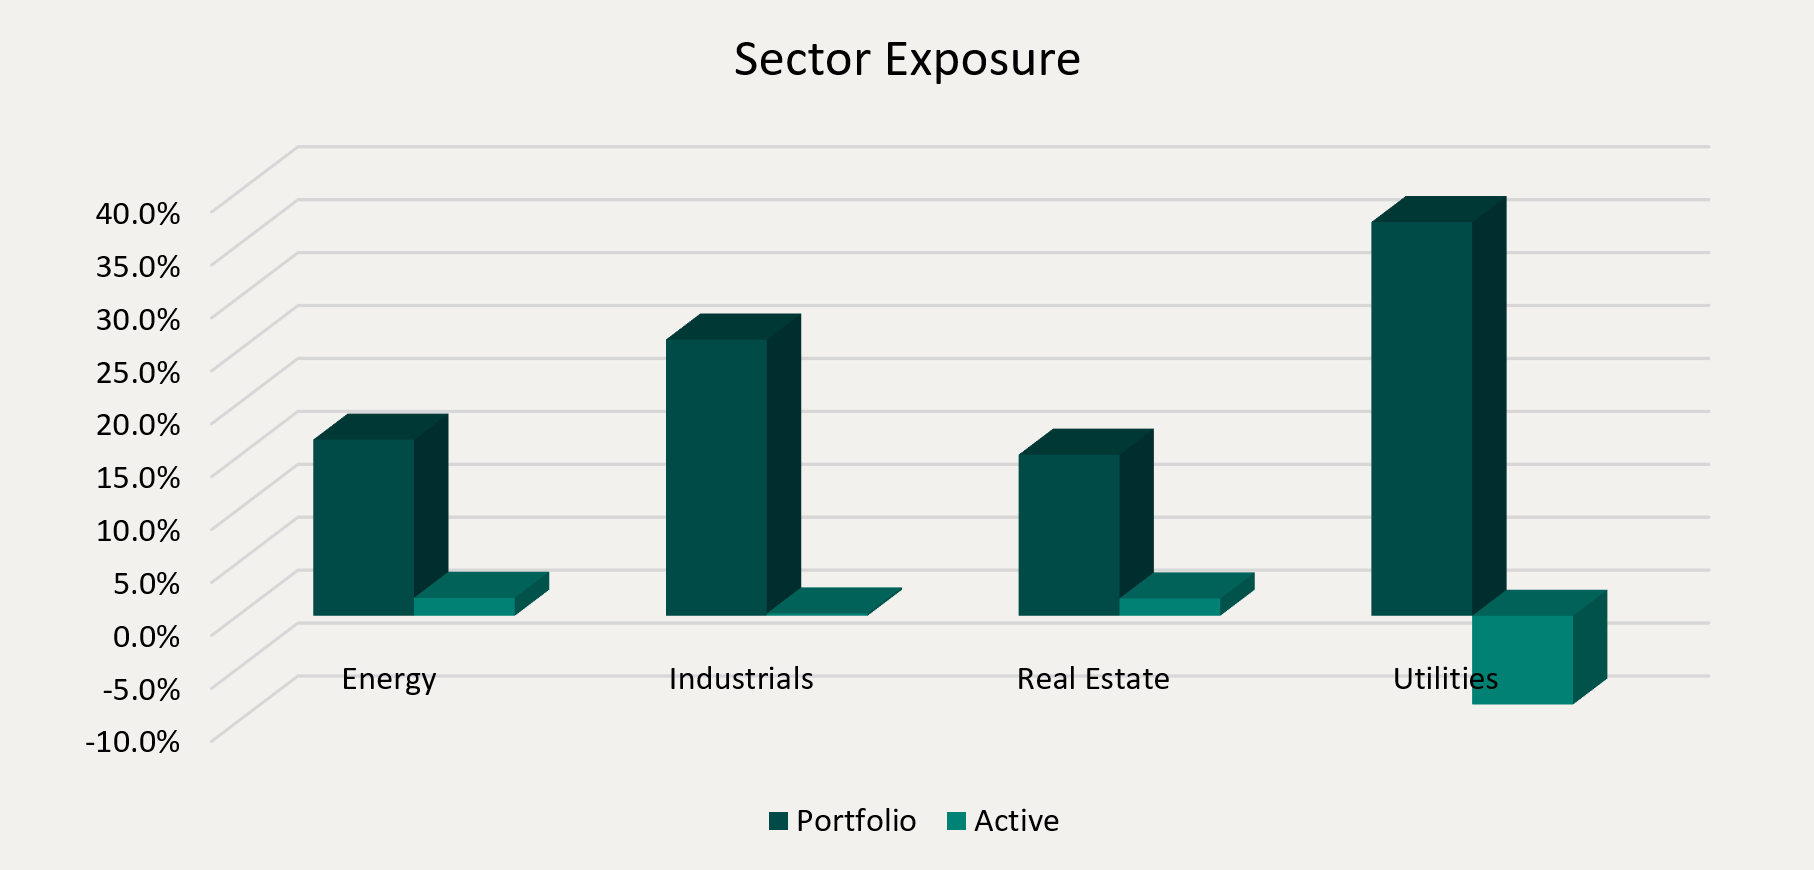
We are currently overweight the Financials, Industrials and Consumer Staples sectors, while underweight the Information Technology, Energy and Materials sectors. We are only about a month into President Trump’s second term, but policy announcements from his administration have already led to greater volatility in the equity, fixed income and currency markets. Although we are optimistic about 2025, the ongoing threat of a global trade war and chaos from the administration will keep the market on edge. To mitigate the swings, we remain focused on high quality, dividend payers that have demonstrated the ability to consistently generate revenue and earnings growth through the business cycle.
The Ninepoint Focused Global Dividend Fund was concentrated in 29 positions as at February 28, 2025 with the top 10 holdings accounting for approximately 37.1% of the fund. Over the prior fiscal year, 19 out of our 29 holdings have announced a dividend increase, with an average hike of 33.2% (median hike of 6.3%). We will continue to apply a disciplined investment process, balancing various quality and valuation metrics, in an effort to generate solid risk-adjusted returns.
Jeffery Sayer, CFA
Ninepoint Partners
References:
1.Walmart Earnings Release (FY25 Q4)
2. TD Cowen- Communications Infrastructure: Data Centers Report. February 21, 2025