 March 31, 2025
Commentary


Silver Remains In a Structural Deficit for the Fourth Straight Year
The United States has anchored the global financial system since the end of World War II through a combination of military might, economic prowess, political stability, and institutional credibility. However, these pillars are beginning to show signs of strain. The on-again, off-again tariffs applied to friend and foe have created significant dysfunction in virtually every segment of the financial markets. This has also magnified the problem of internal dysfunction and fiscal imprudence. As a result, the global economy is beginning to hedge against its historic overreliance on the U.S. system. This reassessment, if it continues, could usher in a multipolar financial order and a rebalancing of global economic power.
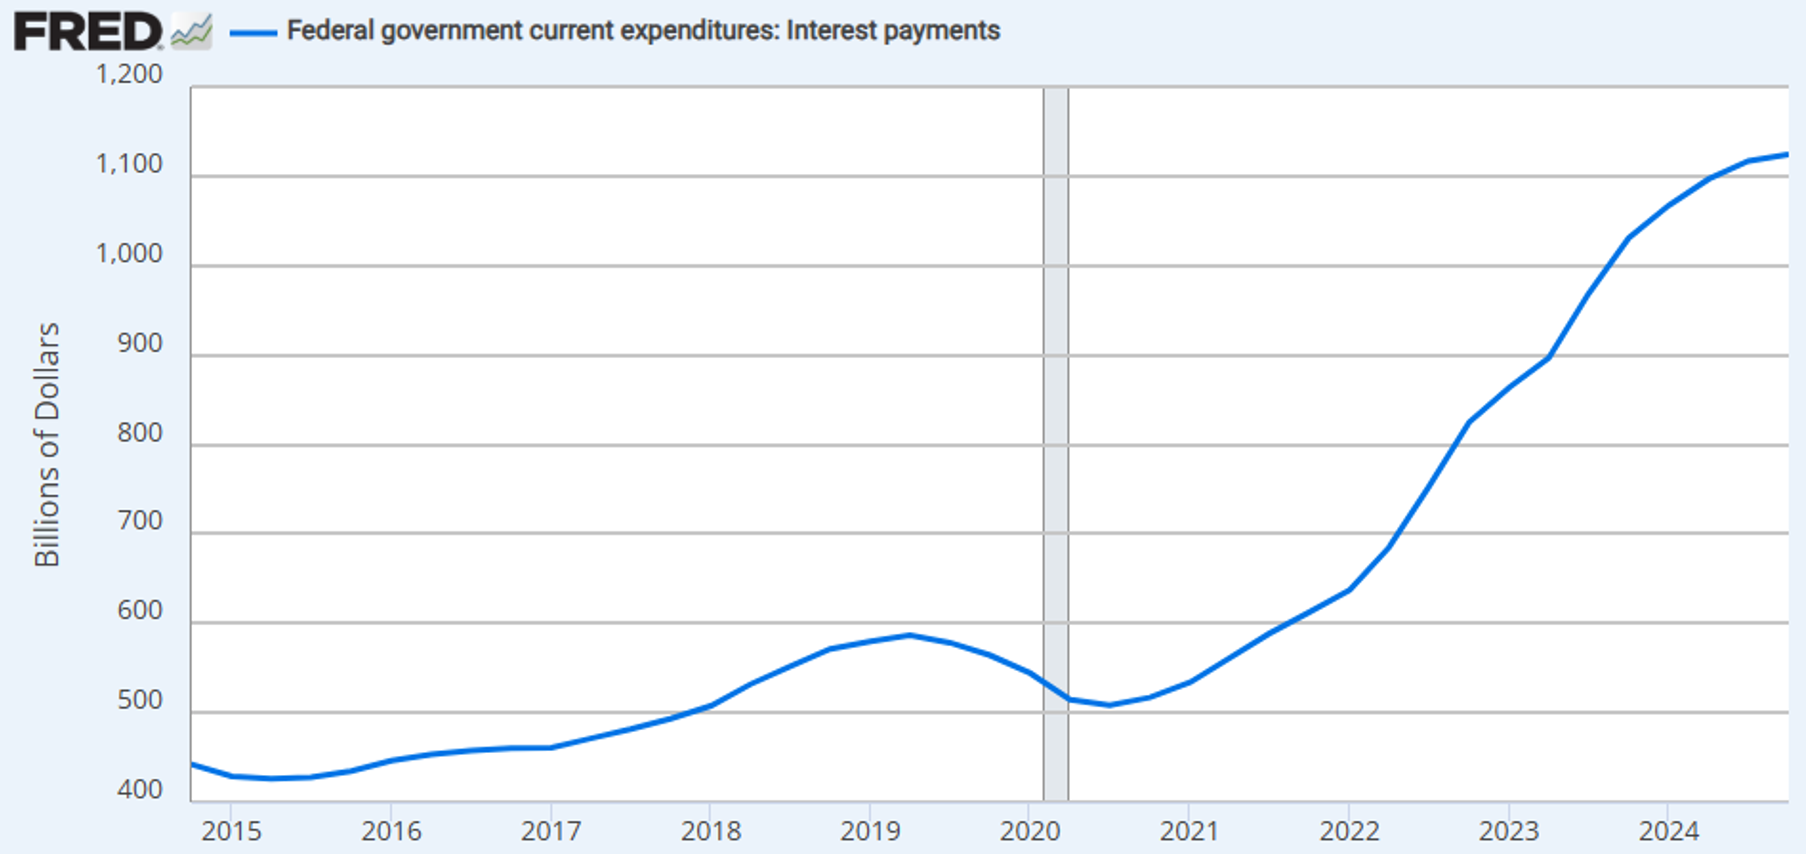
The U.S. is running historically large fiscal deficits, even during periods of economic expansion—an unusual and concerning trend. In our previous commentaries, we have expounded on the perils of mounting debt and the associated interest cost. At the time of writing, the cost of servicing the Federal debt is now the largest expense item for the Federal government, having surpassed $1.1T in the first quarter of 2025. The Congressional Budget Office has repeatedly warned about the long-term unsustainability of U.S. public debt. Markets are beginning to price in concerns that such fiscal excess may lead to inflationary pressures or higher risk premiums on U.S. debt. This has continued to add strains on most investors' bond portfolios, thereby injecting an additional and unwanted level of volatility in people’s retirement accounts.
Cost of Servicing Federal Government Debt Continues to Rise Ever Higher
Traditionally, the U.S. dollar and Treasury securities have functioned as the cornerstone of global safe-haven assets. However, recent market behavior suggests growing investor unease regarding their reliability and status.
Since President Trump’s announcement of “reciprocal tariffs” on April 2, shifts in global trade dynamics and financial markets that normally unfold over years have occurred within days. This period may be remembered as pivotal, comparable to July 1944 (Bretton Woods), August 1971 (end of the gold standard), or September 2008 (global financial crisis).
Unlike prior episodes of market turmoil, such as September 2008 or early 2020, both U.S. Treasury bonds and the dollar depreciated amid a broader sell-off in risk assets. The 10-year Treasury yield rose sharply to 4.5%, while the dollar index declined 9.3% since mid-January. This unusual behavior indicates a potential shift in investor perception of U.S. assets as safe havens.
The divergence reflects concerns over erratic political leadership, rising fiscal deficits, and deteriorating international relations. As noted by Deutsche Bank strategist George Saravelos, markets appear to be reassessing the U.S. dollar's role as the global reserve currency, signalling an accelerated move toward de-dollarization.
While current volatility may prove transitory, these developments suggest the possibility of a structural reconfiguration in global financial markets, with potential long-term consequences for U.S. interest rates and fiscal policy.
Gold and silver continued their advance through the first quarter of this year, propelled by the strong institutional buying as well as commendable flows into ETFs. Pleasingly, precious metal equities are beginning to showcase their leverage to rising bullion prices. Strong gold and silver prices have been translating to strong earnings and cash flows for the miners. The GDX and the SIL (silver miners) rose by 35.56% and 24.17%, respectively. As worries of cost inflation have abated for the miners, investors are beginning to shift their on fundamentals for precious metal equities. Earnings and cash flow are about as fundamental as it gets for valuation purposes. Through the first quarter of 2025, we have seen earnings estimates for the NYSE Arca Gold Miners Index (GDM) rise by nearly 43%, and these estimates are likely to continue rising into year-end as the street remains well behind on the pricing curve. We expect this number to increase further as analysts begin using spot prices rather than their forecast prices. It is important to note that the precious metal miners are seeing their profits rise at a much faster clip than the widely followed S&P 500.
The Silver Institute published its report on supply and demand for 2024, which saw silver demand outpace supply for the fourth consecutive year. The silver market, which remained in a structural deficit and the market in 2024, was undersupplied by 148.9M oz according to the Silver Institute.
Silver Remains in a Structural Deficit
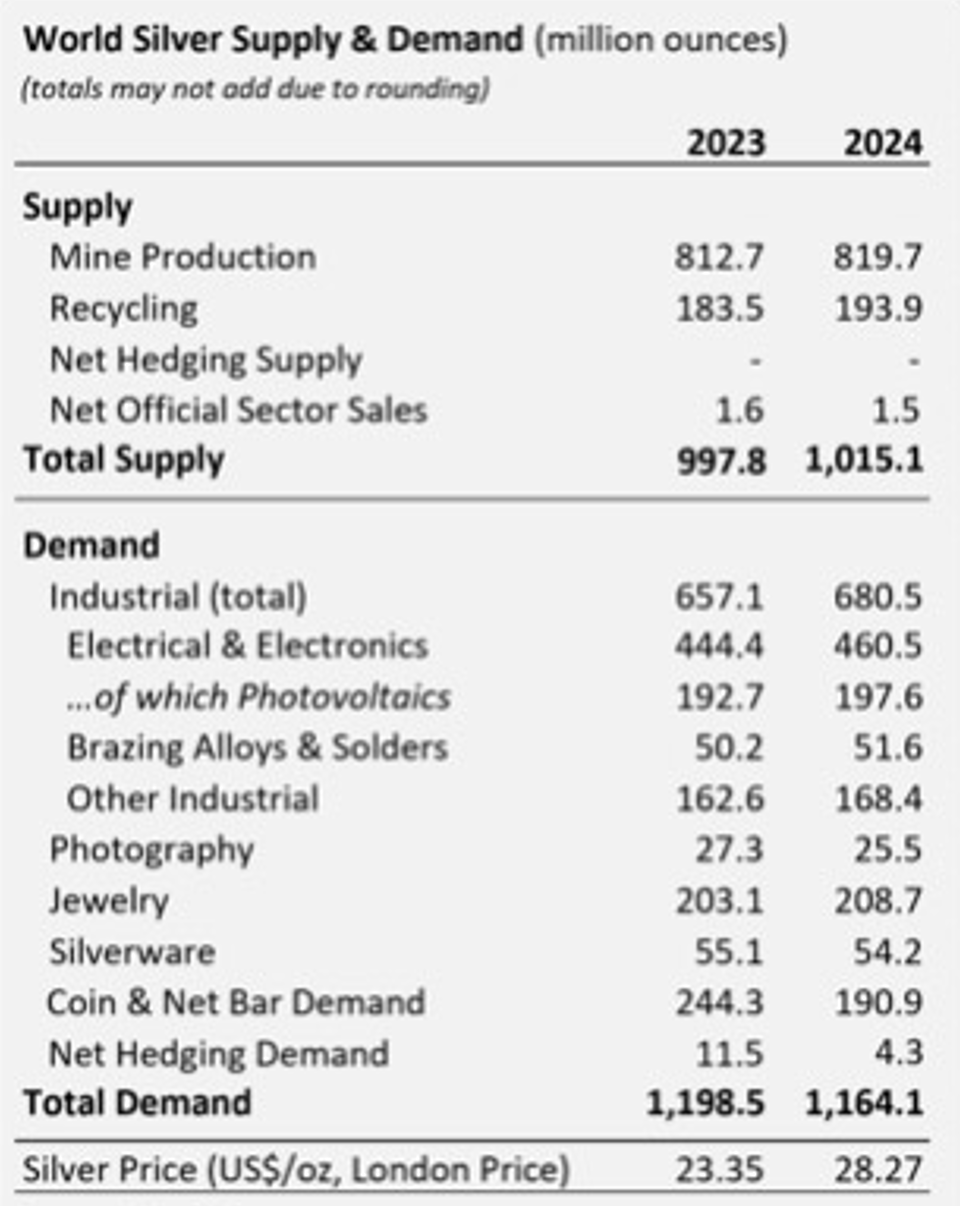
Looking ahead, the Silver Institute believes that U.S. tariffs represent a significant downside risk to silver demand in the current year. A prolonged period of elevated tariffs or an escalation in global trade tensions could disrupt supply chains and substantially dampen global GDP growth. These developments are likely to negatively affect industrial, jewelry, and silverware demand for silver, although physical investment may increase as investors seek safe-haven assets amid heightened economic uncertainty.
The strength in precious metal equities has remained unwavering through the first quarter of 2025. Like we saw in 2024, the moves we have seen in precious metal equities have come on the back of rising earnings and profitability and the upside has come despite negative asset flows. We expect further upside to earnings should current prices hold or strengthen.
Maria Smirnova and Shree Kargutkar
Sprott Asset Management
Sub-advisor to the Ninepoint Silver Equities Fund and the Ninepoint Silver Bullion Fund
NINEPOINT SILVER BULLION FUND - COMPOUNDED RETURNS¹ AS OF MARCH 31, 2025 (SERIES F NPP326) | INCEPTION DATE: MAY 9, 2011
MTD |
YTD |
3M |
6M |
1YR |
3YR |
5YR |
10YR |
Inception |
|
|---|---|---|---|---|---|---|---|---|---|
Fund |
8.71% |
17.60% |
17.60% |
15.90% |
43.34% |
14.95% |
18.32% |
6.89% |
0.20% |
NINEPOINT SILVER EQUITIES FUND - COMPOUNDED RETURNS¹ AS OF MARCH 31, 2025 (SERIES F NPP866) | INCEPTION DATE: FEBRUARY 28, 2012
MTD |
YTD |
3M |
6M |
1YR |
3YR |
5YR |
10YR |
Inception |
|
|---|---|---|---|---|---|---|---|---|---|
Fund |
11.54% |
23.17% |
23.17% |
13.61% |
43.31% |
-2.77% |
13.26% |
7.59% |
-0.26% |