Ninepoint Global Infrastructure Fund - Series F

Overview

Beyond Traditional Infrastructure

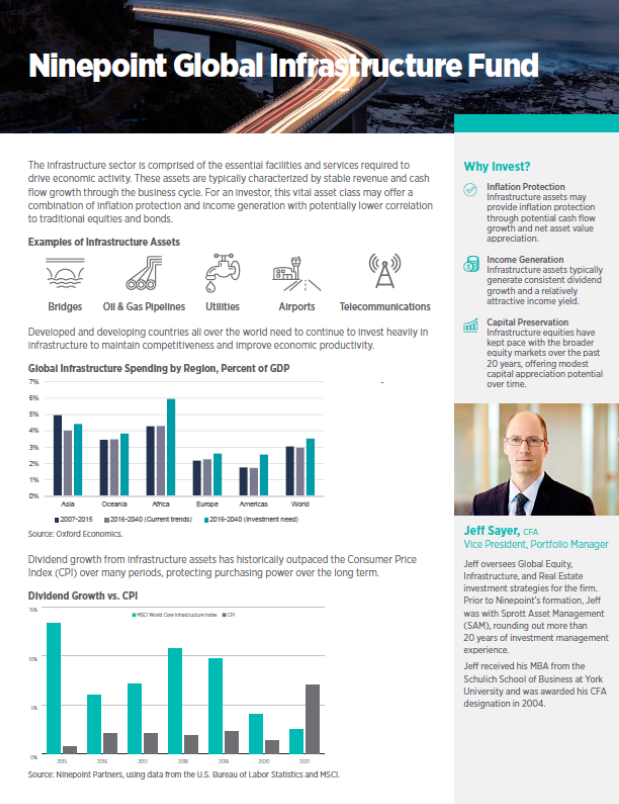
A global equities-based investment solution designed for both inflation protection and income generation. With a focus on maximizing capital growth through strategic securities selection, this Fund invests in a diverse universe of infrastructure equities that expands the traditional view of infrastructure beyond airports, toll roads, and pipelines into a variety of dynamic sectors that can, for example, include cell tower operators, data centers, and independent power producers.

  • Dividend Growth and Inflation Protection

    Dividend Growth and Inflation Protection

    Infrastructure dividend growth has historically outpaced inflation in most periods.

  • Supportive Tailwinds

    Supportive Tailwinds

    Incremental spending and tax credits for enhanced global infrastructure development, including traditional infrastructure, renewable energy and 5G broadband and more.

  • A Diversified Total Infrastructure Approach

    A Diversified Total Infrastructure Approach

    Broader definition of infrastructure: Investing in businesses that share attributes with traditional infrastructure assets, but exhibit higher growth and therefore greater capital appreciation potential.

  • 4.5%<sup>††</sup>  target monthly distribution

    4.5%†† target monthly distribution

Fund Objective

The investment objective of the Fund is primarily to maximize risk adjusted long-term returns and secondarily to achieve a high level of income. The Fund focuses on achieving growth of capital through securities selection and pursues a long-term investment program with the aim of generating capital gains. The Fund seeks to provide a moderate level of volatility and a low degree of correlation to other asset classes through diversifying across a relatively concentrated group of global infrastructure stocks.

Investment Team

  • Jeff Sayer, MBA, CFA
    Vice President, Portfolio Manager
    Jeff Sayer, MBA, CFA
    Vice President, Portfolio Manager
    Jeff Sayer is Vice President, Portfolio Manager at Ninepoint Partners. Jeff oversees Global Equity, Infrastructure, Tactical Balanced and Split Corp investment strategies for the firm. Prior to Ninepoint’s formation, Jeff was with Sprott Asset Management (SAM), rounding out more than 20 years of investment management experience. Jeff received his MBA from the Schulich School of Business at York University and was awarded his CFA designation in 2004.
    View Full Bio
  • Max Barrow
    Analyst
    Max Barrow
    Analyst
    Max Barrow is an Analyst focused on Ninepoint Partner’s equity portfolios. He works directly with the Global Dividend, Global Infrastructure, Canadian Large Cap Leaders Split Corp., and Capital Appreciation Funds. Max joined the firm as an intern in April of 2023 and returned as a full-time Analyst in July of 2024. Prior to joining Ninepoint, he has had experience in the Private Wealth Management industry at CIBC Wood Gundy, servicing high net-worth households.  Max holds a bachelor’s de...
    View Full Bio
  • Zach Chen
    Analyst
    Zach Chen
    Analyst
    Zach Chen is an Analyst on the Ninepoint Global Infrastructure Fund, where he researches infrastructure related equities and the Ninepoint Energy Income Fund, where he assists with the equity option overlay. Prior to Ninepoint Zach interned in Investment Banking M&A at ATB Capital Markets. Zach graduated from Ivey Business School with an HBA and also holds a Bachelor of Engineering Science in Mechatronic Systems Engineering from Western University.
    View Full Bio

Performance

Compound Returns

As at 12/31/2024 (Series F) NPP356
Compound Returns
MTD % YTD % 1Y % 3Y % 5Y % 10Y % Inception %
7.39
As at 1/21/2025
25.42 25.42 9.28 9.55 7.72 8.40
Inception Date: September 1, 2011

Monthly Returns (%)

As at 12/31/2024 (Series F) NPP356
Jan Feb Mar Apr May Jun Jul Aug Sep Oct Nov Dec Total
2024 -1.45 4.08 4.10 -1.79 6.11 -2.87 5.32 1.73 4.97 2.02 6.25 -4.81 25.42
2023 1.27 -2.53 0.95 2.04 -4.71 2.96 1.08 0.44 -3.75 0.83 5.70 -0.07 3.79
2022 -3.64 0.04 6.05 -1.53 0.81 -4.54 6.05 1.78 -6.56 1.38 4.96 -3.59 0.24
2021 0.47 -2.13 2.42 1.74 -0.34 3.31 0.37 2.77 -3.25 4.86 -2.07 4.91 13.43
2020 6.57 -3.79 -9.63 2.05 3.98 -0.98 4.98 -1.24 0.37 0.66 3.83 0.68 6.60
2019 5.37 3.06 4.04 2.66 0.05 0.35 1.52 3.90 0.67 -0.33 0.83 0.02 24.28
2018 -0.27 -1.94 -0.18 1.19 1.36 1.18 2.52 -0.10 -1.41 -5.86 2.99 -6.56 -7.31
2017 -0.74 3.92 2.94 4.35 2.72 -3.10 -1.09 1.93 -0.32 3.78 1.46 -1.66 14.76
2016 -1.39 -2.48 3.10 0.05 5.16 2.39 2.09 -0.10 3.21 -1.34 -1.52 1.42 10.78
2015 5.92 1.58 -1.17 -1.18 -0.32 -3.44 3.61 -4.69 -7.33 4.12 -2.45 -3.14 -8.94
2014 0.48 2.63 1.30 2.28 1.44 2.22 -1.08 4.35 -0.24 -2.59 -0.61 -2.00 8.25
2013 5.55 0.93 0.71 2.55 -0.07 -0.67 0.70 0.80 2.83 4.78 0.20 1.24 21.15
2012 3.74 0.75 0.76 -1.35 -5.08 5.34 -0.77 -1.00 0.16 1.98 -0.71 2.59 6.18
2011 -3.58 4.20 0.39 -1.19 -0.34

Distribution Yields

(Series F) NPP356
Distributions Per Unit Annualized Distribution Yield 12 Month Trailing Yield Distribution Frequency Record Date
$0.39140 32.84% 6.24% Monthly 12/31/2024

Growth of $10,000 Invested

As at 12/31/2024 (Series F) NPP356

Risk Tolerance

  • Low
  • Low - Med
  • Medium
  • Med - High
  • High

Portfolio

As at 12/31/2024

Sector Allocation

Sector Allocation
Sector Weight %
Utilities 43.53
Industrials 22.81
Energy 17.36
Real Estate 14.77
Cash and Cash Equivalents 1.53

Geographic Allocation

Geographic Allocation
Sector Weight %
United States 79.14
Canada 15.69
Netherlands 3.64

Top Ten Holdings

Issuer Name
American Tower Corporation
Cheniere Energy Inc
Enbridge Inc
Energy Transfer Lp
Equinix Inc
Ferrovial Se
Nextera Energy Inc
Nisource Inc
Targa Resources Corp
Union Pacific Corporation

Statistical Analysis

As at 12/31/2024 (Series F) NPP356
Statistics Fund
Cumulative Return 192.00%
Sharpe Ratio 0.43
Standard Deviation 10.52%
Total Positive Months 99
Total Down Months 60
Growth of 10K $29,199.78

Facts, Fees & Fund Codes

Facts
Facts
Fund Type
Global Equity
*Inception Date
Series A: September 20, 2011
Series F: September 1, 2011
Registered Tax Plan Status
Eligible
Distributions
Target 4.5% per annum paid monthly††
Target 6.0% per annum paid monthly
Performance Fee
-
Minimum Initial Investment
$500
Minimum Subsequent Investment
$25
Minimum Investment Term
20 days (1.5% penalty)
Redemptions
Daily
Valuations
Daily
†† Series A, D, F
‡ Series FT, T
*Formerly Exemplar Global Infrastructure Fund. Effective March 31, 2014, Sprott Asset Management LP became the successor manager to the fund. Subsequently, effective August 1, 2017, Ninepoint Partners LP became the manager of the Fund.
Fees
Fees
Management Fee
Series A: 2.00%
Series D: 1.00%
Series F: 1.00%
Series FT: 1.00%
Series T: 2.00%
Fund Codes
Fund Codes
Series A NPP355
Series D NPP335
Series F NPP356
Series FT NPP471
Series T NPP470

Education

Global Infrastructure Fund -  Overview

Related Alt Thinking

  • Infrastructure Equities as a Core Investment: Balancing Stability, Growth, and Income in Changing Economic Environments
    Reasons to Own Infrastructure in a Declining Rate Environment
    The infrastructure asset class includes sectors that are sensitive to both GDP (like Energy and Industries) and interest rates (such as Real Estate and Utilities). These sectors perform differently based on economic growth and interest…
    Infrastructure
  • The Role of Real Assets in a Diversified Portfolio
    The Role of Real Assets in a Diversified Portfolio
    Join Jeff Sayer, Vice President, Portfolio Manager for an update on the Ninepoint Global Infrastructure Fund. The infrastructure asset class includes sectors that are sensitive to both GDP (like Energy…
    Infrastructure
    FP Canada: 0.75

Documents

All returns and fund details are a) based on Series F shares; b) net of fees; c) annualized if period is greater than one year; d) as at 11/29/2024. Top ten holdings, sector allocation and geographic allocation as at 11/29/2024. Top ten holdings based on % of net asset value. Sector allocation based on % of net asset value. Geographic allocation based on % of net asset value and excludes cash. Numbers may not add up due to rounding. Cash and cash equivalents include non-portfolio assets and/or liabilities.

The rate of return is used only to illustrate the effects of the compound growth rate and is not intended to reflect future values of the investment fund or returns on investment in the investment fund.

*The monthly distribution amount may be adjusted by the Manager without notice throughout the year as market conditions change. Monthly distributions will be comprised of net income, net realized capital gains and/or return of capital. Any net income and/or net realized capital gains earned by the Fund in excess of the monthly distribution will be distributed to unitholders annually in December.

The Fund is generally exposed to the following risks: capital depletion risk; concentration risk; credit risk; currency risk; cybersecurity risk; derivatives risk; exchange traded funds risk; foreign investment risk; income trust risk; inflation risk; interest rate risk; liquidity risk; market risk; regulatory risk; securities lending, repurchase and reverse purchase transactions risk; series risk; short selling risk; small company risk; specific issuer risk; tax risk.

Ninepoint Partners LP is the investment manager to a number of funds (collectively, the “Funds”). Commissions, trailing commissions, management fees, performance fees (if any), and other expenses all may be associated with investing in the Funds. Please read the prospectus carefully before investing. The indicated rates of return for series F units of the Funds for the period ended 11/29/2024 are based on the historical annual compounded total returns including changes in unit value and reinvestment of all distributions or dividends and do not take into account sales, redemption, distribution or optional charges or income taxes payable by any securityholder that would have reduced returns. Mutual funds are not guaranteed, their values change frequently and past performance may not be repeated. This communication does not constitute an offer to sell or solicitation to purchase securities of the Funds.

The information contained herein does not constitute an offer or solicitation by anyone in the United States or in any other jurisdiction in which such an offer or solicitation is not authorized or to any person to whom it is unlawful to make such an offer or solicitation. Prospective investors who are not resident in Canada should contact their financial advisor to determine whether securities of the Fund may be lawfully sold in their jurisdiction.

© 2024 Morningstar Research Inc. All rights reserved. The information contained herein: (1) is proprietary to Morningstar and/or its content providers; (2) may not be copied or distributed; (3) and is not warranted to be accurate, complete, or timely. Neither Morningstar nor its content providers are responsible for any damages or losses arising from any use of this information. Past performance is no guarantee of future results.

Morningstar Ranking/Number of Funds in Category displays the Fund’s actual rank within its Morningstar Category based on average annual total return and number of funds in that Category. The ranking is subject to change every month.

The Morningstar Risk Adjusted Return (MRARs), commonly referred to as the Star Rating, relate the risk-adjusted performance of a fund to its peers with the same CIFSC Fund category for the period ended as noted and are subject to change monthly. Morningstar calculates ratings for categories with at least 5 funds. To determine a fund’s rating, the fund and its peer are ranked by their MRARs. If a fund scores in the top 10% of its category, it receives five stars (High); if it falls in the next 22.5% , it receives four stars (Above Average); the next 35% earns a fund three stars(Neutral or Average); those in the next 22.5% received two stars (Below Average); and the lowest 10% received one star (Low). The overall rating is a weighted combination of the 3, 5 and 10 year ratings. For greater detail, see morningstar.ca.

LSEG Lipper Fund Awards, ©2024 Refinitiv. All rights reserved. Used under license.

The fund has been named LSEG Lipper Fund Awards Canada 2024 Winner, Best Global Infrastructure Equity Fund (Series D), over a five-year period out of a total of 13 funds ending July 31, 2024.

The LSEG Lipper Fund Awards, granted annually, highlight funds and fund companies that have excelled in delivering consistently strong risk-adjusted performance relative to their peers.

The LSEG Lipper Fund Awards are based on the Lipper Leader for Consistent Return rating, which is a risk-adjusted performance measure calculated over 36, 60 and 120 months. The fund with the highest Lipper Leader for Consistent Return (Effective Return) value in each eligible classification wins the LSEG Lipper Fund Award. For more information, see lipperfundawards.com Although Refinitiv Lipper makes reasonable efforts to ensure the accuracy and reliability of the data contained herein, the accuracy is not guaranteed by Refinitiv Lipper.

The merit of the winners is based on objective, quantitative criteria. The influential and prestigious LSEG Lipper Fund Awards are based on our Lipper Leaders Rating for Consistent Return. Lipper Leaders Ratings are subject to change on a monthly basis. Individual classifications of three, five, and 10-year periods, as well as fund families with high average scored for the three-year period, are also recognized. The awards are based on LSEG Lipper’s proven proprietary methodology, which can be viewed here.

Ninepoint Partners LP: Toll Free: 1.866.299.9906. Dealer Services: CIBC Mellon GSSC Record Keeping Services: Toll Free: 1.877.358.0540