Ninepoint Global Infrastructure Fund
August 2023 Commentary
Summary
- Ninepoint Global Infrastructure Fund had a YTD return of 1.25% as of August 31, outperforming the MSCI World Core Infrastructure Index, which had a YTD return of -3.43%.
- In August, Fund generated a total return of 0.44% while the Index generated a total return of -2.12%.
- Despite a strong final week, the month of August was a mildly disappointing one for investors.
- The primary culprit blamed for the weakness in equities was the sharp move in rates from 4.00% to 4.34% (reaching a 10-year high), which is generally correlated to P/E multiple compression, influenced by factors like the Bank of Japan's monetary policy shift, US sovereign debt downgrades, and rising inflation concerns.
- Q2 2023 earnings season for S&P 500 companies performed better than expected, with a 4.1% YoY earnings decline, possibly marking the earnings trough for the cycle.
- The fund was concentrated in 28 positions. Over the prior fiscal year, 18 out of our 28 holdings have announced a dividend increase, with an average hike of 13.0% (median hike of 5.6%).
Monthly Update
Year-to-date to August 31, the Ninepoint Global Infrastructure Fund generated a total return of 1.25% compared to the MSCI World Core Infrastructure Index, which generated a total return of -3.43%. For the month, the Fund generated a total return of 0.44% while the Index generated a total return of -2.12%.
Ninepoint Global Infrastructure Fund - Compounded Returns¹ As of August 31, 2023 (Series F NPP356) | Inception Date: September 1, 2011
| 1M | YTD | 3M | 6M | 1YR | 3YR | 5YR | 10YR | Inception | |
| Fund | 0.4% | 1.3% | 4.5% | 2.6% | -3.0% | 6.7% | 6.4% | 6.8% | 7.1% |
| MSCI World Core Infrastructure NR (CAD) | -2.1% | -3.4% | -0.4% | -2.3% | -4.8% | 4.4% | 5.5% | 9.6% | 10.2% |
Despite a strong final week, the month of August was a mildly disappointing one for investors. Although the S&P 500 declined 1.8%, the intra month peak to trough drawdown was approximately 5.5%, which was really nothing more than a typical correction considering the year-to-date rally in tech stocks. During the month, the Energy sector was the standout performer but weakness in the Consumer Discretionary, Utilities and Financials sectors dragged the index lower. The primary culprit blamed for the weakness in equities was the sharp move in rates from 4.00% to 4.34% (reaching a 10-year high), which is generally correlated to P/E multiple compression.
But why did rates move so sharply? At the very end of July, the announcement from the Bank of Japan shifting monetary policy away from strict yield curve control likely started the trend higher around the world. The Fitch Ratings downgrade of US sovereign debt from AAA to AA+ (justified with the statement: “The rating downgrade of the United States reflects the expected fiscal deterioration over the next three years, a high and growing general government debt burden, and the erosion of governance relative to ‘AA’ and ‘AAA’ rated peers over the last two decades that has manifested in repeated debt limit standoffs and last-minute resolutions.”) was not great news. The Moody’s credit downgrade of ten US-based small and mid-sized banks (with at least six others placed on negative watch) also wasn’t helpful. Further, monthly CPI data for July (released on August 10th) was unchanged from June at +0.2% but ticked up on an annualized basis to 3.2% in July, slightly more than the 3.0% recorded in June. Fed speakers continued to talk tough on inflation and the Chairman Powell’s speech at the Jackson Hole Economic Symposium was almost a carbon copy of his most recent FOMC presser. A lot of noise but thankfully nothing to suggest that a deep recession, characterized by plunging corporate profits and spiraling unemployment is imminent.
In fact, the Q2 2023 earnings season has essentially come to close (with over 99% of the S&P having reported results) and was much better than originally feared. Initial expectations were for a decline of somewhere between 8% and 9%, but 79% of S&P 500 companies reported a positive EPS surprise and 64% of S&P 500 companies reported a positive revenue surprise (according to FactSet). For Q2, the blended year-over-year earnings decline for the S&P 500 was 4.1%, the third straight quarter of negative earnings growth but likely the bottom for the cycle. If the Q2 proves to be the earnings trough (consistent with current consensus estimates), we could see a more diversified group of stocks play “catch-up” even if the headline indexes move sideways or drift lower, as earnings growth reaccelerates. In this environment, we are searching for companies that have been able to post solid earnings growth but still trade at acceptable valuations. Dividend growth companies and real asset strategies look poised to benefit from any rotation out of the high-multiple, technology winners of 2023.
In an environment of moderating inflation but slowing growth through 2023 and into 2024, the most important drivers of investment performance will likely be valuation, balance sheet strength and the ability to consistently generate cash flow and earnings. Should the year-to-date rally broaden beyond anything tied to the artificial intelligence investment theme, a rotation into high quality, dividend growers would result in better relative performance from our strategies going forward. In keeping with our mandates, we are concentrating our efforts on free cash flow positive, high quality, dividend growth companies and real asset investments given our positive assessment of the risk/reward outlook over the next two to three years.
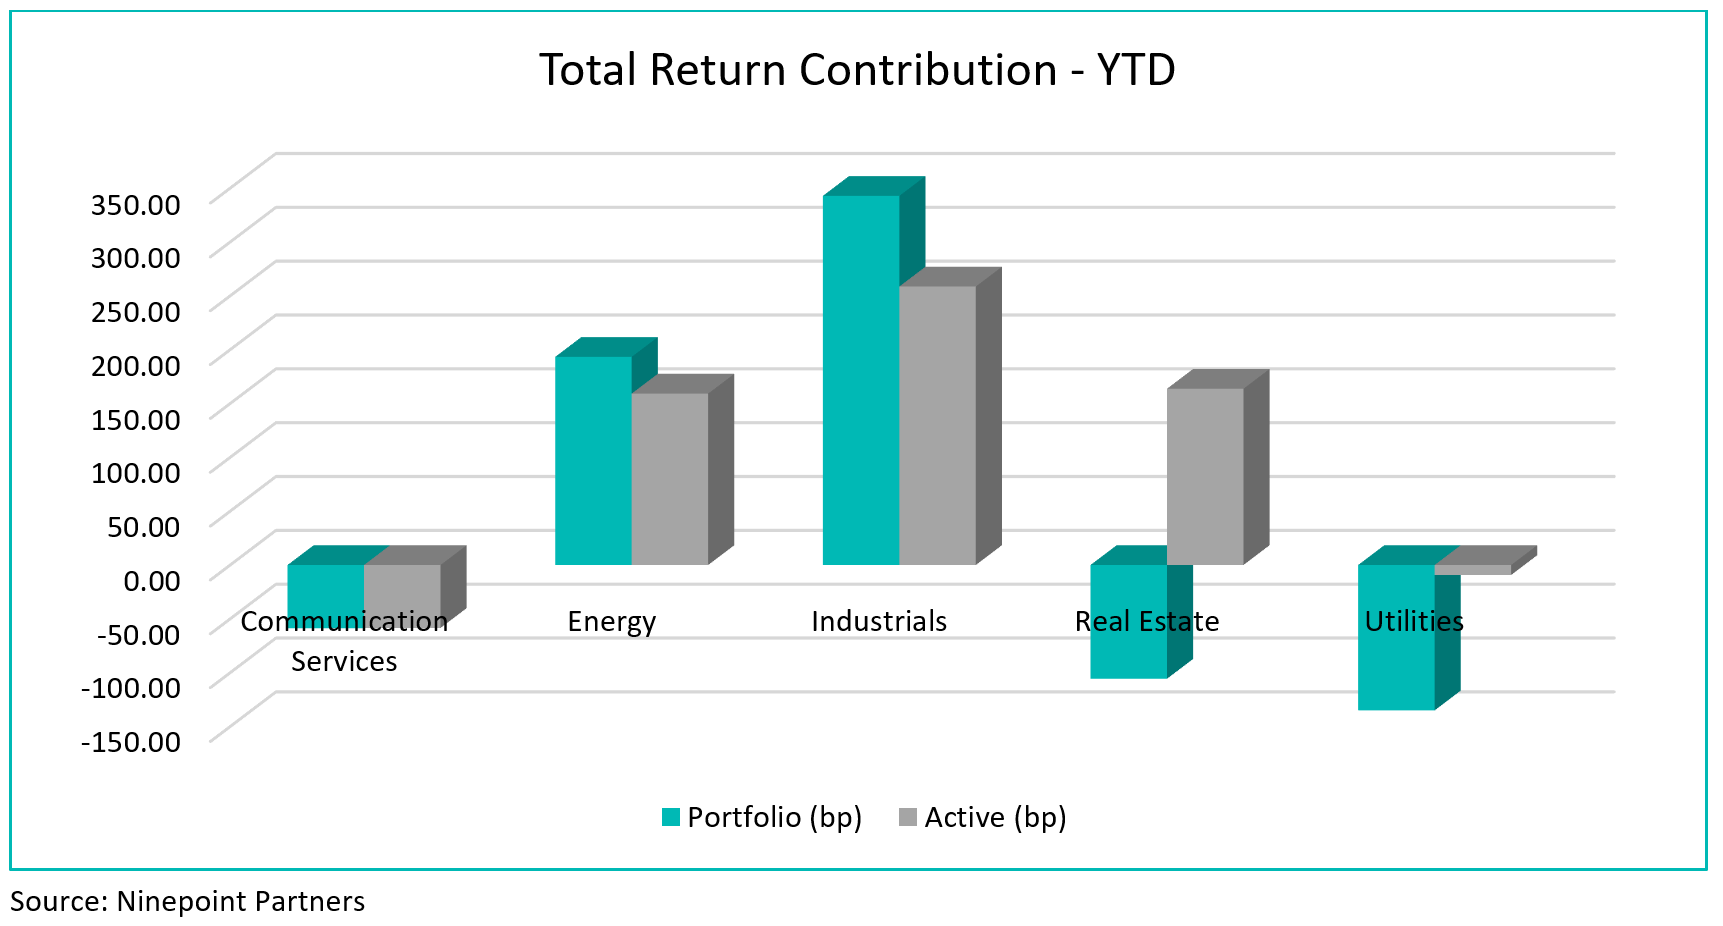
Top contributors to the year-to-date performance of the Ninepoint Global Infrastructure Fund by sector included Industrials (+343 bps) and Energy (+193 bps) while top detractors by sector included Utilities (-135 bps), Real Estate (-106 bps) and Communication (-59 bps) on an absolute basis.
On a relative basis, positive return contributions from the Industrials (+259 bps), Real Estate (+164 bps) and Energy (+159 bps) sectors were offset by a negative contribution from the Communication (-58 bps) and Utilities (-9 bps) sectors.
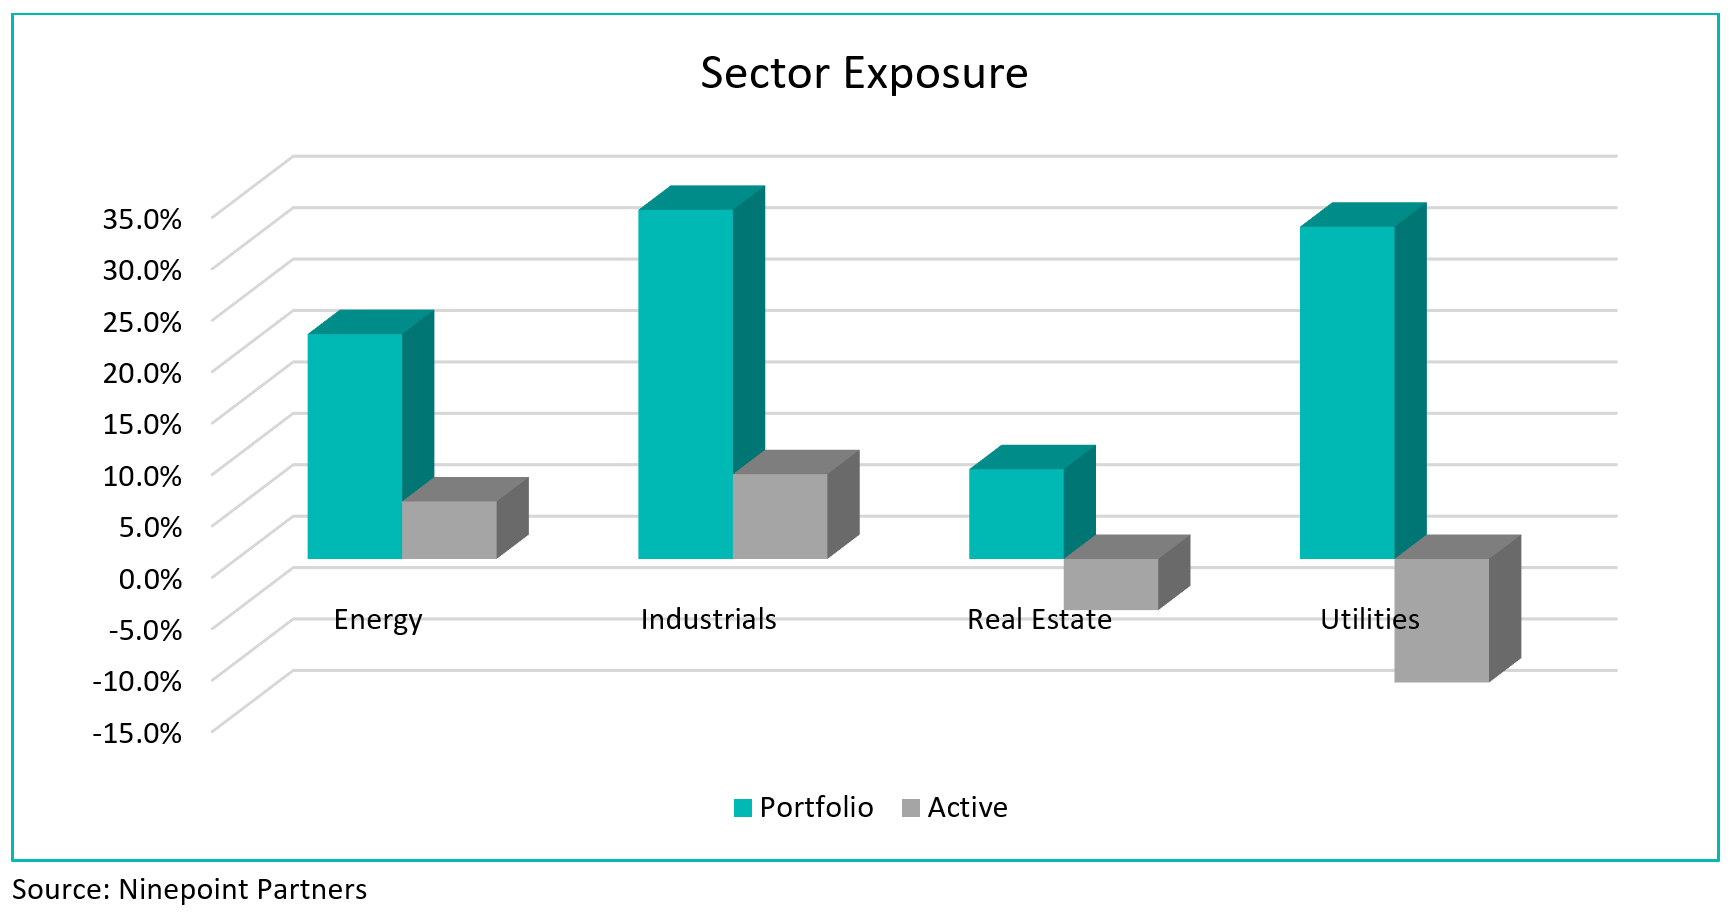
We are currently overweight the Industrials and Energy sectors, while underweight the Utilities and Real Estate sectors. With the probability of a future interest rate hike below 50% for each of the three remaining FOMC meetings in 2023 according to Refinitiv, interest rate hikes are likely done for the cycle. While we are cognizant of the lagged impact of 525 basis points of monetary tightening since March 2022 and aware of the potential for seasonal weakness in September/October, we are comfortable with our portfolio positioning today. We remain focused on high quality, dividend payers that have demonstrated the ability to consistently generate revenue and earnings growth through the cycle.
We continue to believe that the clean energy transition will be one of the biggest investment themes for many years ahead and infrastructure stands to be a clear beneficiary. Therefore, we are comfortable having exposure to both traditional energy investments and renewable energy investments given the importance of energy sustainability and security of supply around the world.
The Ninepoint Global Infrastructure Fund was concentrated in 28 positions as at August 31, 2023 with the top 10 holdings accounting for approximately 39.7% of the fund. Over the prior fiscal year, 18 out of our 28 holdings have announced a dividend increase, with an average hike of 13.0% (median hike of 5.6%). Using a total infrastructure approach, we will continue to apply a disciplined investment process, balancing valuation, growth, and yield in an effort to generate solid risk-adjusted returns.
Jeffrey Sayer, CFA
Ninepoint Partners
Refinitiv Lipper Fund Awards, ©2022 Refinitiv. All rights reserved. Used under license.
The fund has been named Refinitiv Lipper Fund Awards Canada 2022 Winner, Best Global Infrastructure Equity Fund, over a three-year period out of a total of 13 funds ending July 31, 2022.
Lipper Award Methodology
The Refinitiv Lipper Fund Awards, granted annually, highlight funds and fund companies that have excelled in delivering consistently strong risk-adjusted performance relative to their peers.
The Refinitiv Lipper Fund Awards are based on the Lipper Leader for Consistent Return rating, which is a risk-adjusted performance measure calculated over 36, 60 and 120 months. The fund with the highest Lipper Leader for Consistent Return (Effective Return) value in each eligible classification wins the Refinitiv Lipper Fund Award. For more information, see lipperfundawards.com Although Refinitiv Lipper makes reasonable efforts to ensure the accuracy and reliability of the data contained herein, the accuracy is not guaranteed by Refinitiv Lipper.
The merit of the winners is based on objective, quantitative criteria. The influential and prestigious Refinitiv Lipper Fund Awards are based on our Lipper Leaders Rating for Consistent Return. Lipper Leaders Ratings are subject to change on a monthly basis. Individual classifications of three, five, and 10-year periods, as well as fund families with high average scored for the three-year period, are also recognized. The awards are based on Refinitiv Lipper’s proven proprietary methodology, which can be viewed here.
1 All returns and fund details are a) based on Series F units; b) net of fees; c) annualized if period is greater than one year; d) as at August 31, 2023; e) 2011 annual returns are from 09/01/11 to 12/31/11. The index is 100% MSCI World Core Infrastructure NR (CAD) and is computed by Ninepoint Partners LP based on publicly available index information.
The Fund is generally exposed to the following risks. See the prospectus of the Fund for a description of these risks: capital depletion risk; concentration risk; credit risk; currency risk; cybersecurity risk; derivatives risk; exchange traded funds risk; foreign investment risk; income trust risk; inflation risk; interest rate risk; liquidity risk; market risk; regulatory risk; securities lending, repurchase and reverse purchase transaction risk; series risk; short selling risk; small company risk; specific issuer risk; tax risk.
Ninepoint Partners LP is the investment manager to the Ninepoint Funds (collectively, the “Funds”). Commissions, trailing commissions, management fees, performance fees (if any), other charges and expenses all may be associated with mutual fund investments. Please read the prospectus carefully before investing. The indicated rate of return for series F units of the Fund for the period ended August 31, 2023 is based on the historical annual compounded total return including changes in unit value and reinvestment of all distributions and does not take into account sales, redemption, distribution or optional charges or income taxes payable by any unitholder that would have reduced returns. Mutual funds are not guaranteed, their values change frequently and past performance may not be repeated. The information contained herein does not constitute an offer or solicitation by anyone in the United States or in any other jurisdiction in which such an offer or solicitation is not authorized or to any person to whom it is unlawful to make such an offer or solicitation. Prospective investors who are not resident in Canada should contact their financial advisor to determine whether securities of the Fund may be lawfully sold in their jurisdiction.
The opinions, estimates and projections (“information”) contained within this report are solely those of Ninepoint Partners LP and are subject to change without notice. Ninepoint Partners makes every effort to ensure that the information has been derived from sources believed to be reliable and accurate. However, Ninepoint Partners assumes no responsibility for any losses or damages, whether direct or indirect, which arise out of the use of this information. Ninepoint Partners is not under any obligation to update or keep current the information contained herein. The information should not be regarded by recipients as a substitute for the exercise of their own judgment. Please contact your own personal advisor on your particular circumstances. Views expressed regarding a particular company, security, industry or market sector should not be considered an indication of trading intent of any investment funds managed by Ninepoint Partners. Any reference to a particular company is for illustrative purposes only and should not to be considered as investment advice or a recommendation to buy or sell nor should it be considered as an indication of how the portfolio of any investment fund managed by Ninepoint Partners is or will be invested. Ninepoint Partners LP and/or its affiliates may collectively beneficially own/control 1% or more of any class of the equity securities of the issuers mentioned in this report. Ninepoint Partners LP and/or its affiliates may hold short position in any class of the equity securities of the issuers mentioned in this report. During the preceding 12 months, Ninepoint Partners LP and/or its affiliates may have received remuneration other than normal course investment advisory or trade execution services from the issuers mentioned in this report.
Ninepoint Partners LP: Toll Free: 1.866.299.9906. DEALER SERVICES: CIBC Mellon GSSC Record Keeping Services: Toll Free: 1.877.358.0540

Awards

Related Funds
Historical Commentary
- Global Infrastructure Fund 12/2023
- Global Infrastructure Fund 11/2023
- Global Infrastructure Fund 10/2023
- Global Infrastructure Fund 09/2023
- Global Infrastructure Fund 07/2023
- Global Infrastructure Fund 06/2023
- Jeff Sayer - H1 2023 Market Review and Outlook - Real Asset Strategies
- Global Infrastructure Fund 05/2023
- Global Infrastructure Fund 04/2023
- Global Infrastructure Fund 03/2023
- Global Infrastructure Fund 02/2023
- Global Infrastructure Fund 01/2023
Toronto, Ontario M5J 2J1 Canada