Ninepoint Global Real Estate Fund
November 2023 Commentary
Summary
- Ninepoint Global Real Estate Fund had a YTD return of -2.0% up to November 30, compared to the MSCI World IMI Core Real Estate Index with a total return of 1.2%.
- In November, the Fund generated a total return of 7.54%, while the Index had a return of 8.12%.
- November's market rally followed the Fed's decision to maintain rates, likely signaling the end of the tightening phase culminating with a spike in US 10-year bond yields.
- Concerns still exist regarding the Fed's ability to engineer a soft landing post a substantial 525 bps worth of tightening, despite current economic resilience.
- Market expectations suggest approximately five rate cuts in 2024, prompting debates about whether this would be consistent with a soft-landing scenario as anticipated by the equity markets.
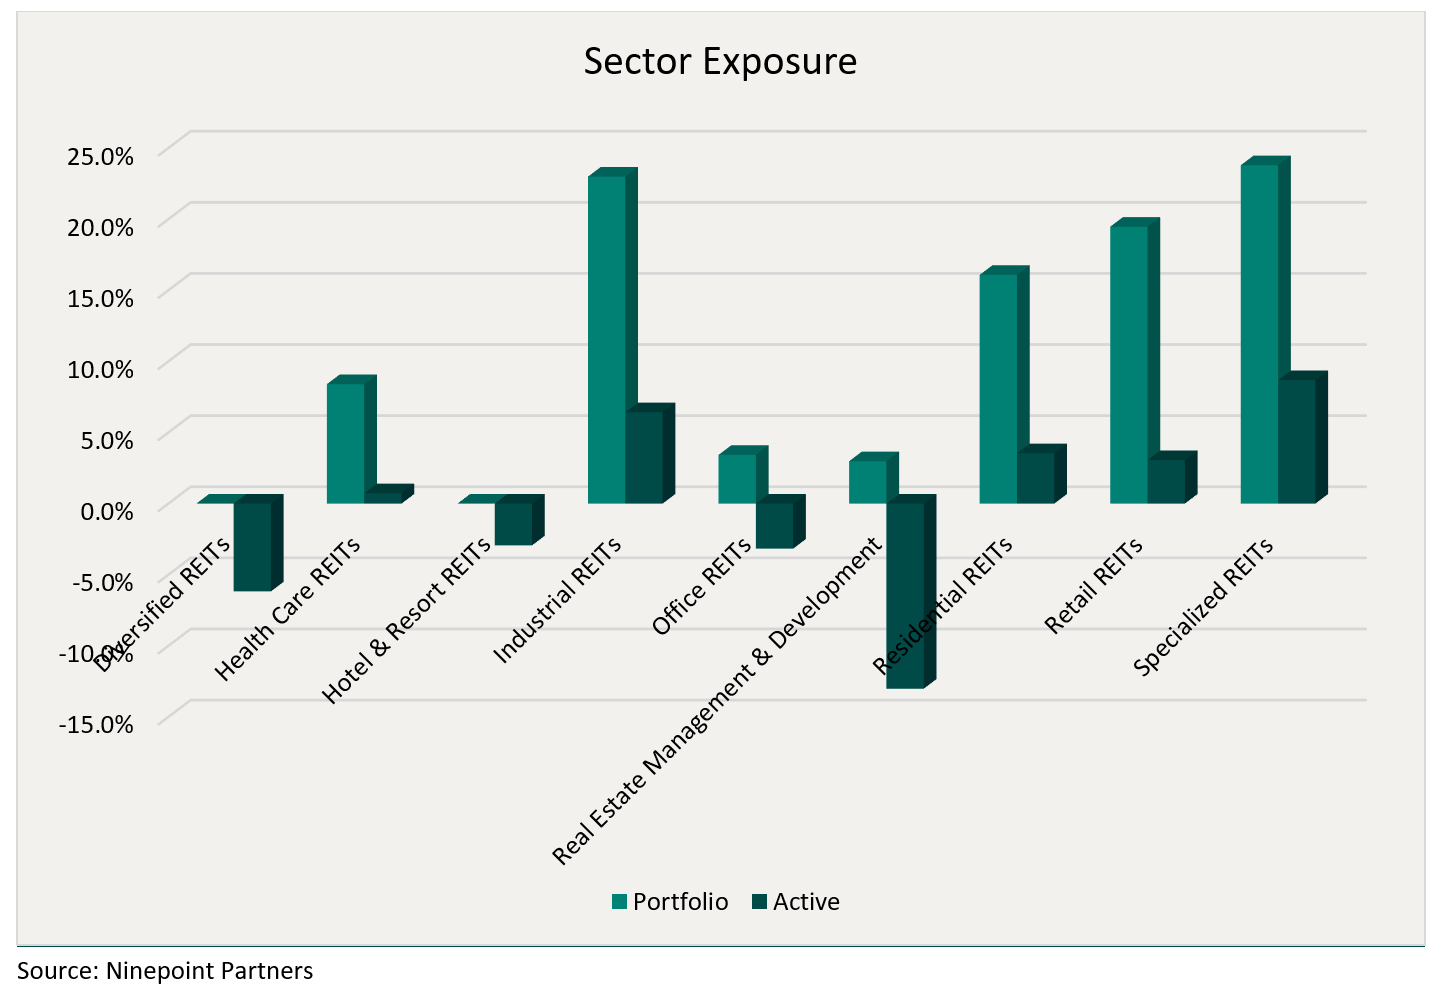
- The Fund is currently overweight Specialized REITs, Industrial REITs, and Residential REITs while underweight Real Estate Management & Development, Diversified REITs, and Office REITs.
- The fund was concentrated in 27 positions, with the top 10 holdings accounting for approximately 43.0% of the fund. Over the prior fiscal year, 19 out of our 27 holdings have announced a dividend increase, with an average hike of 13.1% (median hike of 3.8%).
Monthly Update
Year-to-date to November 30, the Ninepoint Global Real Estate Fund generated a total return of -1.98% compared to the MSCI World IMI Core Real Estate Index, which generated a total return of 1.21%. For the month, the Fund generated a total return of 7.54% while the Index generated a total return of 8.12%.
Ninepoint Global Real Estate Fund - Compounded Returns¹ As of November 30, 2023 (Series F NPP132) | Inception Date: August 5, 2015
| 1M | YTD | 3M | 6M | 1YR | 3YR | 5YR | Inception | |
| Fund | 7.5% | -2.0% | -2.6% | -2.6% | -5.6% | 1.2% | 3.0% | 5.5% |
| MSCI World IMI Core Real Estate NR (CAD) | 8.1% | 1.2% | -0.8% | 2.7% | -1.8% | 1.1% | 0.7% | 2.3% |
After the seasonally weak August to October period, the markets experienced a powerful relief rally in November. The move was likely triggered by the October 31 to November 1 Fed meeting, where members of the FOMC committee voted to hold rates steady in a range of 5.25% to 5.50% and Chairman Powell’s post-meeting press conference essentially confirmed that the tightening phase of the interest rate cycle is now done. We believe that the final spike in the US 10-year bond yields to just above 5.0% effectively tightened financial conditions to a sufficient degree to satisfy the FOMC committee. We had previously identified the rate spike as the primary culprit of weakness across various financial asset classes and as the US 10-year bond yield fell, short sellers covered positions and buyers stepped in aggressively.
The debate now turns to whether the Fed can engineer a soft-landing or whether the lagged impact of 525 bps of tightening will eventually do more serious damage to the US economy. Thankfully, the economic data is slowing but remains relatively resilient thus far. Released early-December, the November PMI data was consistent with a mild slowdown in goods as the ISM Manufacturing PMI remained in contractionary territory at 46.7% but modest growth in services as the ISM Services PMI registered 52.7%. Excess slack in the labour market also seems to be fading, although November’s nonfarm payroll report increased by 199,000 jobs and the unemployment rate ticked down to 3.7%. We still see diminishing upwards pressure on wages in the absence of any fear of widespread job losses, which is consistent with a soft-landing scenario. Incorporating new information in real-time, the forward curve is currently indicating approximately five rate cuts in 2024. We believe that the 125 bps of anticipated easing in 2024 is inconsistent with a dovish/bullish scenario (growth would likely have to weaken dramatically for that amount of Fed easing, which wouldn’t be particularly good for the equity markets), but only a couple of rate cuts would still be needed to improve the odds of a soft-landing.
Importantly, if the November rally is to continue into 2024, earnings growth will need to reaccelerate. Entering the Q3 earnings season, expectations were quite low and consensus estimates suggested a slight decline, which would have resulted in four consecutive quarters of negative growth. However, with 98% of the S&P 500 companies having reported actual results, the blended year-over-year earnings growth rate is 4.8%, which certainly helped stocks to rally in November. Based on earnings year-to-date and consensus estimates looking forward, earnings are expected to rebound approximately 11% in 2024, according to FactSet. After a flat year for earnings in 2023, a return to earnings growth in a soft-landing scenario should be well received by the equity markets. As always, we are continually searching for companies that can post solid earnings growth but still trade at acceptable valuations today.
Through the trough of the cycle, the most important drivers of investment performance will likely be valuation, balance sheet strength and the ability to consistently generate cash flow and earnings. In keeping with our mandates, we are concentrating our research efforts on high quality, dividend growth companies and real asset investments given our positive assessment of the risk/reward outlook over the next few years. After many years of outperformance from the high-growth and high valuation Information Technology sector, as capital becomes more expensive, we expect a rotation out of the big winners of 2023 and into equities more aligned with our dividend-focused mandates in 2024.
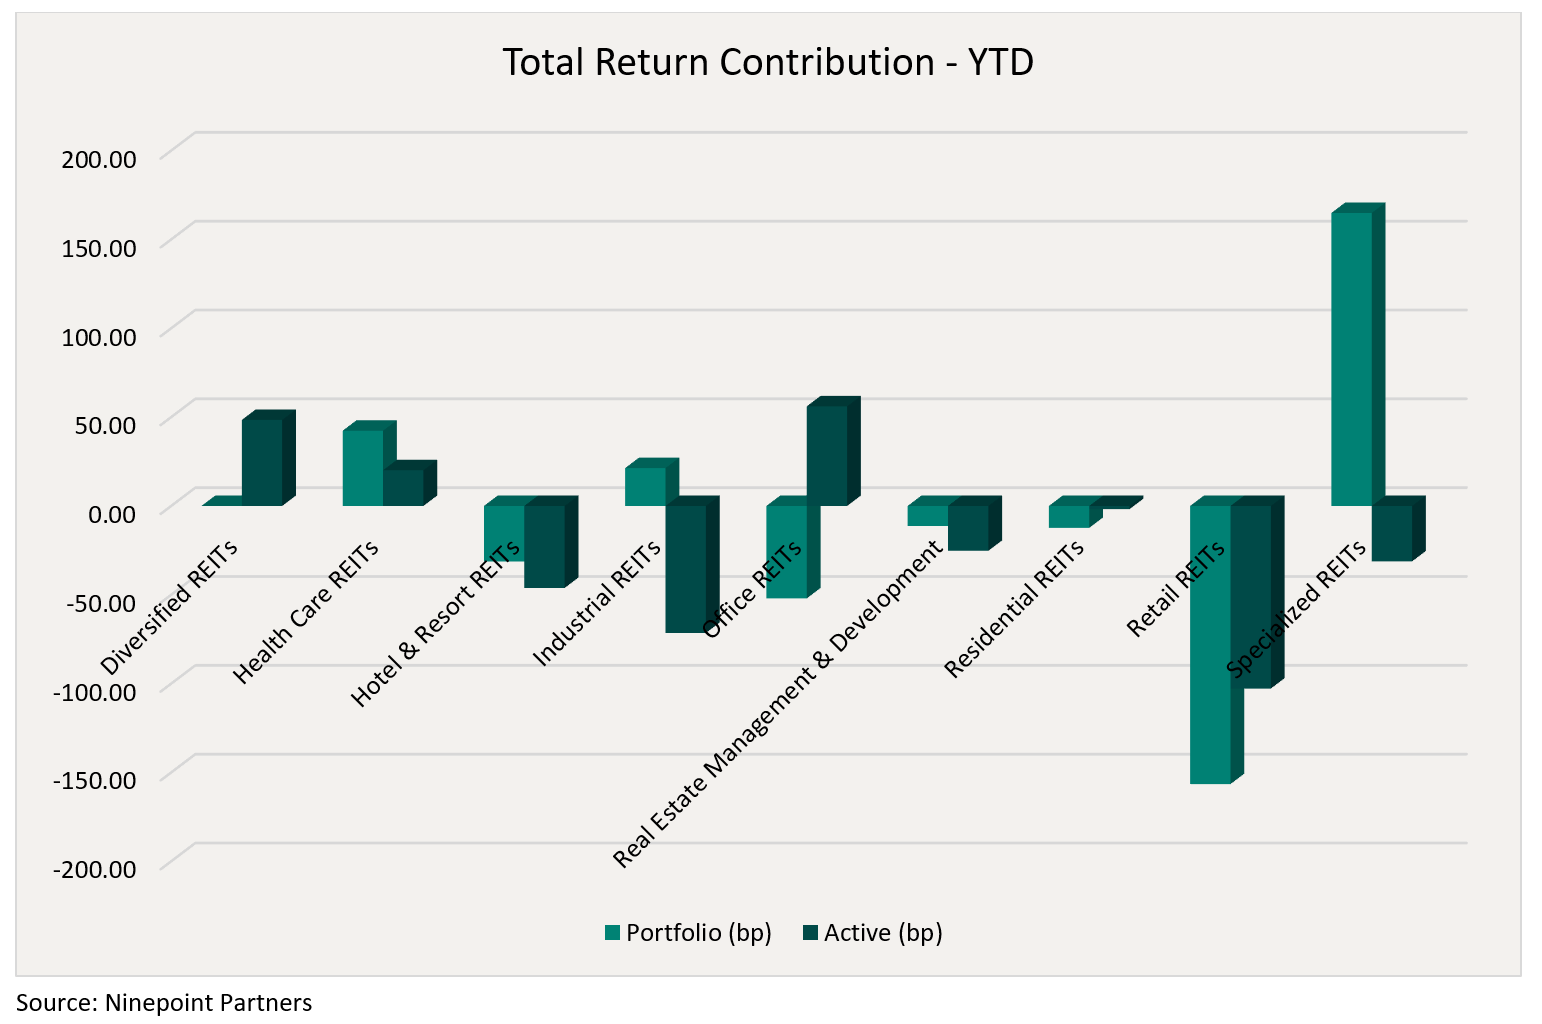
Top contributors to the year-to-date performance of the Ninepoint Global Real Estate Fund by sub-industry included Specialized REITs (+165 bps), Health Care REITs (+42 bps) and Industrial REITs (+21 bps), while top detractors by sub-industry included Retail REITs (-157 bps), Office REITs (-52 bps) and Hotel & Resort REITs (-31 bps) on an absolute basis.
On a relative basis, positive return contributions from the Office REITs (+56 bps), Diversified REITs (+48 bps) and Health Care REITs (+20 bps) sub-industries were offset by negative contributions from the Retail REITs (-102 bps), Industrial REITs (-71 bps) and Hotel & Resort REITs (-46 bps) sub-industries.
We are currently overweight Specialized REITs, Industrial REITs, and Residential REITs while underweight Real Estate Management & Development, Diversified REITs, and Office REITs. Although the lagged impact of monetary tightening is now slowing inflation, constraining growth, and creating higher unemployment, we expect a Fed pivot to easier monetary policy at some point in 2024. In the meantime, we remain focused on high quality, dividend payers that have demonstrated the ability to consistently generate revenue and cash flow growth through the business cycle.
The Ninepoint Global Real Estate Fund was concentrated in 27 positions as at November 30, 2023 with the top 10 holdings accounting for approximately 43.0% of the fund. Over the prior fiscal year, 19 out of our 27 holdings have announced a dividend increase, with an average hike of 13.1% (median hike of 3.8%). Using a total real estate approach, we will continue to apply a disciplined investment process, balancing valuation, growth, and yield in an effort to generate solid risk-adjusted returns.
Jeffrey Sayer, CFA
Ninepoint Partners
Effective February 7, 2017 the Sprott Global REIT & Property Equity Fund’s name was changed to Sprott Global Real Estate Fund, subsequently on August 1, 2017 becoming Ninepoint Global Real Estate Fund.
1All returns and fund details are a) based on Series F units; b) net of fees; c) annualized if period is greater than one year; d) as at November 30, 2023; e) 2015 annual returns are from 08/04/15 to 12/31/15. The index is 100% MSCI World IMI Core Real Estate NR (CAD) and is computed by Ninepoint Partners LP based on publicly available index information.
The Fund is generally exposed to the following risks. See the Simplified Prospectus of the Fund for a description of these risks: capital depletion risk, concentration risk, credit risk, currency risk, cybersecurity risk; derivatives risk, emerging markets risk, equity real estate investment trust (REIT) risk, exchange traded funds risk, foreign investment risk, income trust risk, inflation risk, interest rate risk, liquidity risk, market risk, preferred stock risk; real estate risk; regulatory risk; securities lending, repurchase and reverse purchase transaction risk; series risk; short selling risk; specific issuer risk; substantial securityholfer risk; tax risk.
Ninepoint Partners LP is the investment manager to the Ninepoint Funds (collectively, the “Funds”). Commissions, trailing commissions, management fees, performance fees (if any), and other expenses all may be associated with investing in the Funds. Please read the prospectus carefully before investing. The indicated rate of return for series F units of the Fund for the period ended November 30, 2023 is based on the historical annual compounded total return including changes in unit value and reinvestment of all distributions and does not take into account sales, redemption, distribution or optional charges or income taxes payable by any unitholder that would have reduced returns. Mutual funds are not guaranteed, their values change frequently and past performance may not be repeated. The information contained herein does not constitute an offer or solicitation by anyone in the United States or in any other jurisdiction in which such an offer or solicitation is not authorized or to any person to whom it is unlawful to make such an offer or solicitation. Prospective investors who are not resident in Canada should contact their financial advisor to determine whether securities of the Fund may be lawfully sold in their jurisdiction.
The opinions, estimates and projections (“information”) contained within this report are solely those of Ninepoint Partners LP and are subject to change without notice. Ninepoint Partners makes every effort to ensure that the information has been derived from sources believed to be reliable and accurate. However, Ninepoint Partners assumes no responsibility for any losses or damages, whether direct or indirect, which arise out of the use of this information. Ninepoint Partners is not under any obligation to update or keep current the information contained herein. The information should not be regarded by recipients as a substitute for the exercise of their own judgment. Please contact your own personal advisor on your particular circumstances. Views expressed regarding a particular company, security, industry or market sector should not be considered an indication of trading intent of any investment funds managed by Ninepoint Partners. Any reference to a particular company is for illustrative purposes only and should not to be considered as investment advice or a recommendation to buy or sell nor should it be considered as an indication of how the portfolio of any investment fund managed by Ninepoint Partners is or will be invested. Ninepoint Partners and/or its affiliates may collectively beneficially own/control 1% or more of any class of the equity securities of the issuers mentioned in this report. Ninepoint Partners and/or its affiliates may hold short position in any class of the equity securities of the issuers mentioned in this report. During the preceding 12 months, Ninepoint Partners and/or its affiliates may have received remuneration other than normal course investment advisory or trade execution services from the issuers mentioned in this report.
Ninepoint Partners LP: Toll Free: 1.866.299.9906. DEALER SERVICES: CIBC Mellon GSSC Record Keeping Services: Toll Free: 1.877.358.0540

Related Funds
Historical Commentary
- Global Real Estate Fund 12/2023
- Global Real Estate Fund 10/2023
- Global Real Estate Fund 09/2023
- Global Real Estate Fund 08/2023
- Global Real Estate Fund 07/2023
- Global Real Estate Fund 06/2023
- Jeff Sayer - H1 2023 Market Review and Outlook - Real Asset Strategies
- Global Real Estate Fund 05/2023
- Global Real Estate Fund 04/2023
- Global Real Estate Fund 03/2023
- Global Real Estate Fund 02/2023
- Global Real Estate Fund 01/2023
Toronto, Ontario M5J 2J1 Canada